|

OKLO poised to surge past $100

Oklo Inc (NYSE: OKLO) is rewriting the rules of the energy sector. While traditional utilities struggle with aging infrastructure, this nuclear innovator has delivered 300%+ gains since April 2025 – turning skeptics into believers. The sector hasn’t seen this level of disruptive potential since the early days of solar. Today, we break down OKLO’s Elliott Wave structure, key targets, and why bulls remain in control.

Elliott Wave Analysis

OKLO’s explosive rally since April has decisively breached February’s $59.14 peak (Wave I), confirming a strong 3-wave advance in motion. The current impulse shows Wave ((1)) peaking at $73.55, Wave ((2)) bottoming at $50.08, and Wave ((3)) now extends higher. This incomplete bullish sequence forms part of a larger nesting structure within Wave III – typically the strongest and most extended phase in Elliott Wave theory.

OKLO Daily Chart

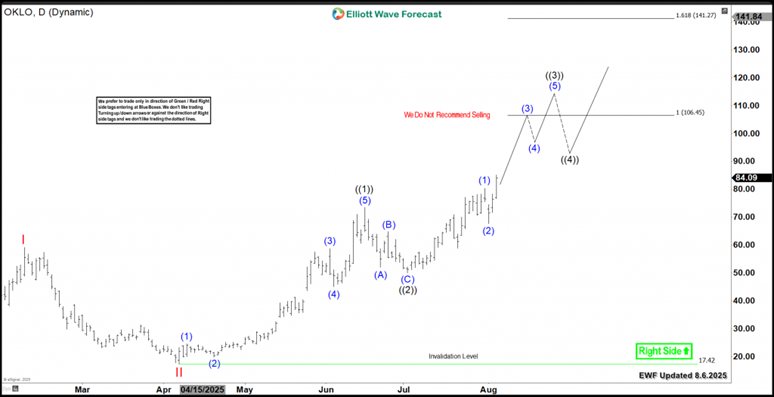
OKLO’s daily cycle analysis from April 2025 lows reveals a textbook Elliott Wave progression. Subsequently, the stock now surges through Wave ((3)) and our projections confirm an equal legs target between $106-$141, with multiple technical factors supporting this outlook.

Conclusion

The bullish sequence formed by OKLO will support the stock through the upcoming short term corrections, creating opportunities to buy daily and weekly pullbacks using our Elliott Wave strategy. Consequently, the ideal approach is to enter positions once the stock completes a 3, 7, or 11 swing corrective sequence during pullbacks. Moreover, our extreme Blue Box system enhances precision, allowing traders to identify optimal entry points with clarity and confidence.

Author

Elliott Wave Forecast Team

Elliott Wave Forecast Team

ElliottWave-Forecast.com

More from Elliott Wave Forecast Team
Share:

Editor's Picks

EUR/USD onsolidates around mid-1.1800s as traders keenly await FOMC Minutes

The EUR/USD pair struggles to capitalize on the previous day's goodish rebound from the 1.1800 neighborhood, or a one-and-a-half-week low, and consolidates in a narrow band during the Asian session on Wednesday. Spot prices currently trade just below mid-1.1800s, nearly unchanged for the day.

GBP/USD bounces off lows, retargets 1.3550

After bottoming out just below the 1.3500 yardstick, GBP/USD now gathers some fresh bids and advances to the 1.3530-1.3540 band in the latter part of Tuesday’s session. Cable’s recovery comes as the Greenback surrenders part of its advance, although it keeps the bullish bias well in place for the day.

Gold bounces back toward $4,900, looks to FOMC Minutes

Gold is attempting a bounce from the $4,850 level, having touched a one-week low on Tuesday. Signs of progress in US–Iran talks dented demand for the traditional safe-haven bullion, weighing on Gold in early trades. However, rising bets for more Fed rate cuts keep the US Dollar bulls on the defensive and act as a tailwind for the non-yielding yellow metal. Traders now seem reluctant ahead of the FOMC Minutes, which would offer cues about the Fed's rate-cut path and provide some meaningful impetus.

DeFi could lift crypto market from current bear phase: Bitwise

Bitwise Chief Investment Officer Matt Hougan hinted that the decentralized finance sector could lead the crypto market out of the current bear phase, citing Aave Labs’ latest community proposal as a potential signal of good things to come.

UK jobs market weakens, bolstering rate cut hopes

In the UK, the latest jobs report made for difficult reading. Nonetheless, this represents yet another reminder for the Bank of England that they need to act swiftly given the collapse in inflation expected over the coming months. 

Ripple slides to $1.45 as downside risks surge

Ripple edges lower at the time of writing on Tuesday, from the daily open of $1.48, as headwinds persist across the crypto market. A short-term support is emerging at $1.45, but a buildup of bearish positions could further weaken the derivatives market and prolong the correction.