Oil Technical Analysis: WTI bears looking at the 53.50 support

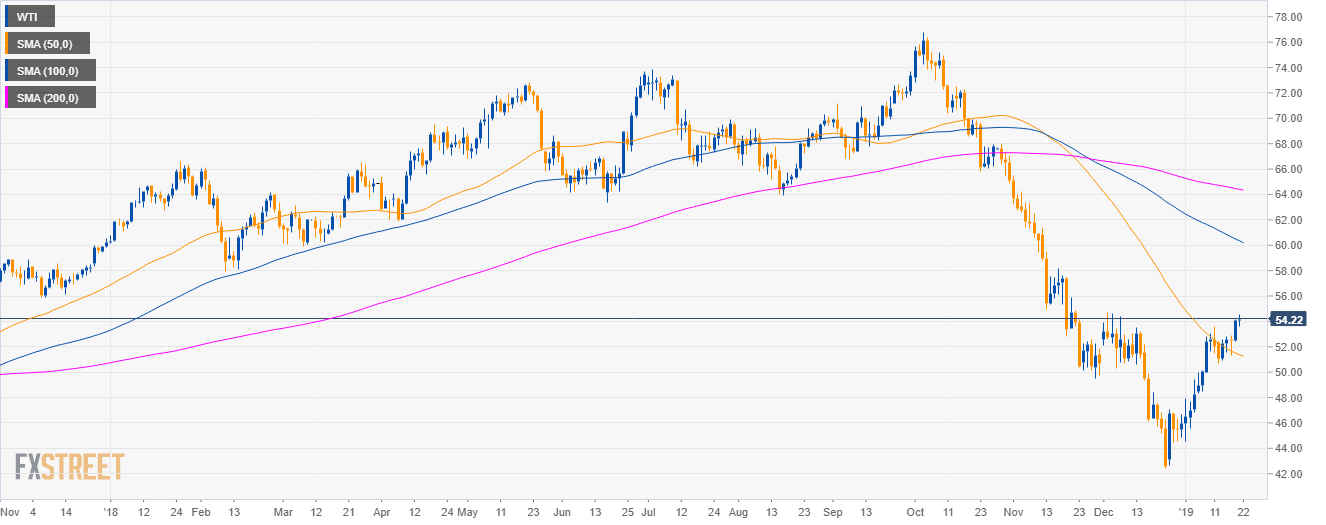
Oil daily chart
- Crude oil WTI is in a bear trend below the 100 and 200-day simple moving averages (SMAs).
- However, bulls broke above the 54.00 figure and the 50 SMA.
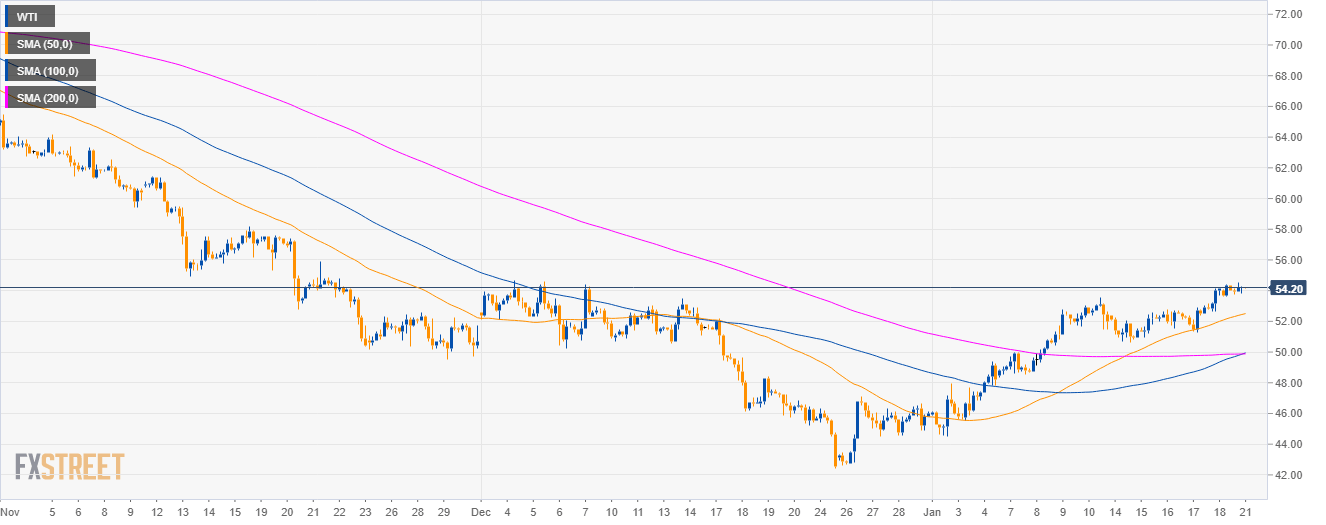
Oil 4-hour chart
- WTI bulls have reclaimed the main SMAs suggesting bullish momentum in the near-term.
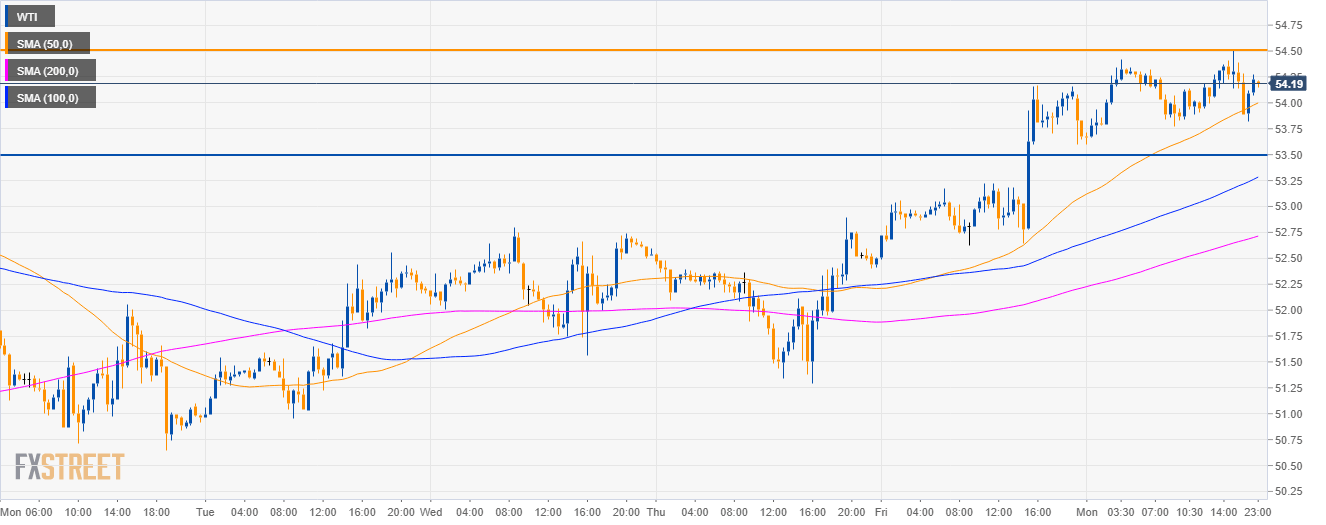
Oil 30-minute chart
- WTI is set to depreciate below the 54.50 resistance as bears might lead the market to 53.50 support.
Additional key levels
WTI
Overview:
Today Last Price: 54.23
Today Daily change: 0.12 pips
Today Daily change %: 0.22%
Today Daily Open: 54.11
Trends:
Daily SMA20: 49.2
Daily SMA50: 50.93
Daily SMA100: 59.71
Daily SMA200: 64.11
Levels:
Previous Daily High: 54.17
Previous Daily Low: 52.4
Previous Weekly High: 54.17
Previous Weekly Low: 50.65
Previous Monthly High: 54.68
Previous Monthly Low: 42.45
Daily Fibonacci 38.2%: 53.49
Daily Fibonacci 61.8%: 53.08
Daily Pivot Point S1: 52.95
Daily Pivot Point S2: 51.79
Daily Pivot Point S3: 51.18
Daily Pivot Point R1: 54.72
Daily Pivot Point R2: 55.33
Daily Pivot Point R3: 56.49
Author

Flavio Tosti
Independent Analyst


