Oil Technical Analysis: Black Gold takes a plunge down and exceeds the 53.50 bear target

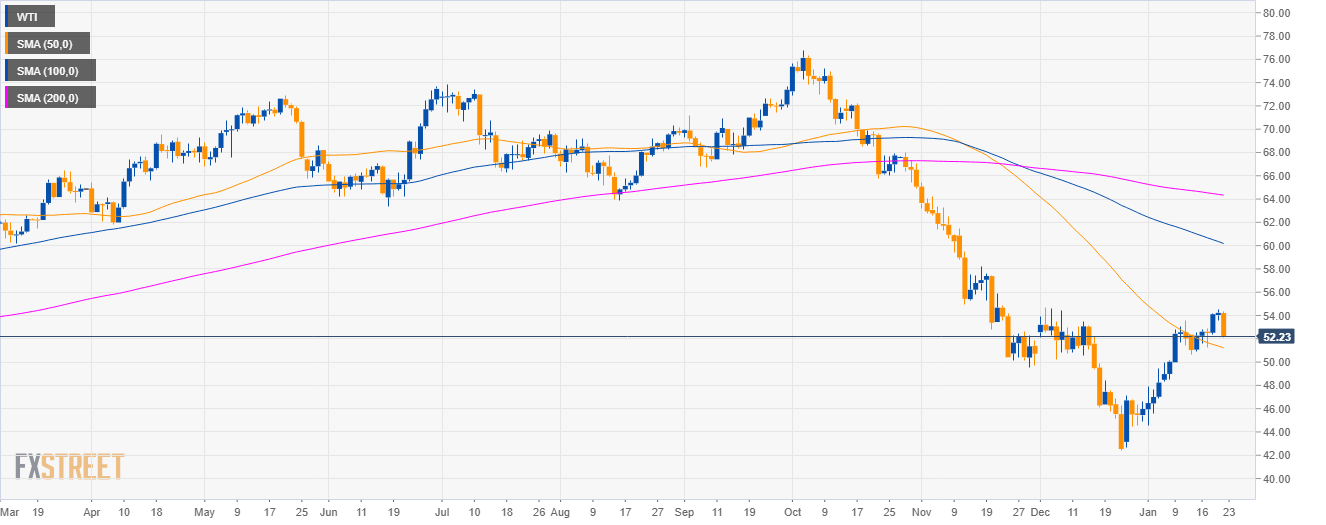
Oil daily chart
- Crude oil WTI is in a bear trend below the 100 and 200-day simple moving averages (SMAs).
- As forecast, WTI declined as the 53.50 target was hit and exceeded.
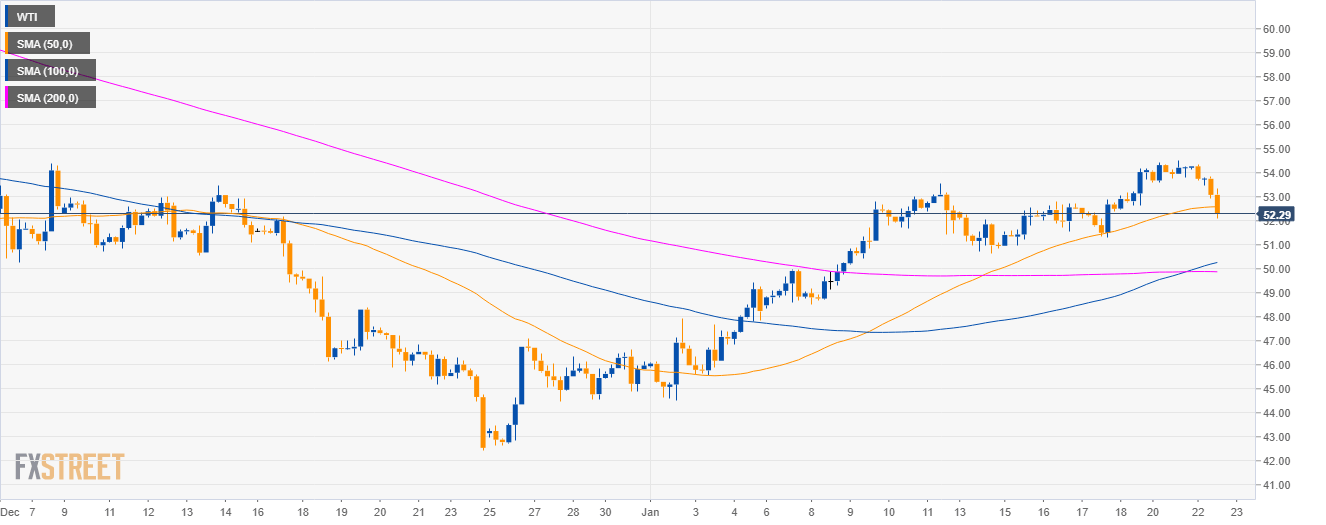
Oil 4-hour chart
- WTI bears are testing the 50 SMA.
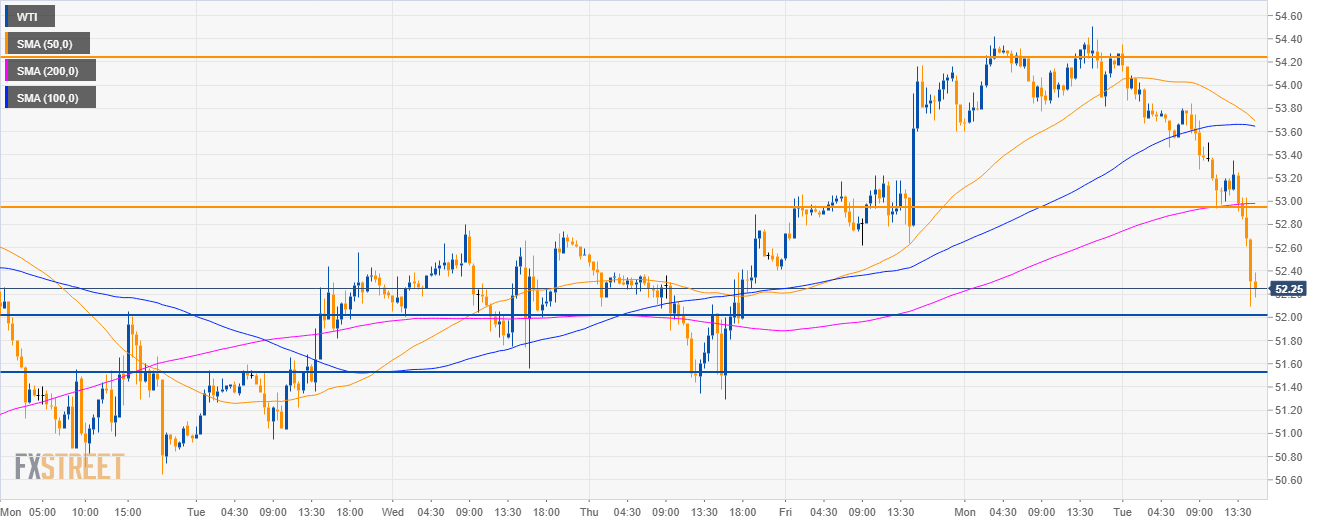
Oil 30-minute chart
- Bears smashed through many support levels and the main SMAs.
- The next objective for sellers is to attack the 52.00 and 51.50 levels.
- The main resistance is seen at the 53.00 figure.
Additional key levels
WTI
Overview:
Today Last Price: 52.27
Today Daily change: -1.96 pips
Today Daily change %: -3.61%
Today Daily Open: 54.23
Trends:
Daily SMA20: 49.63
Daily SMA50: 50.88
Daily SMA100: 59.56
Daily SMA200: 64.03
Levels:
Previous Daily High: 54.51
Previous Daily Low: 53.6
Previous Weekly High: 54.17
Previous Weekly Low: 50.65
Previous Monthly High: 54.68
Previous Monthly Low: 42.45
Daily Fibonacci 38.2%: 54.16
Daily Fibonacci 61.8%: 53.95
Daily Pivot Point S1: 53.72
Daily Pivot Point S2: 53.2
Daily Pivot Point S3: 52.81
Daily Pivot Point R1: 54.63
Daily Pivot Point R2: 55.02
Daily Pivot Point R3: 55.54
Author

Flavio Tosti
Independent Analyst


