NZD/USD weakens as risk-off sentiment lifts the US Dollar
- NZD/USD weakens as US-Israel strikes on Iran trigger risk-off sentiment.
- RBNZ-Fed policy divergence keeps downside pressure limited.
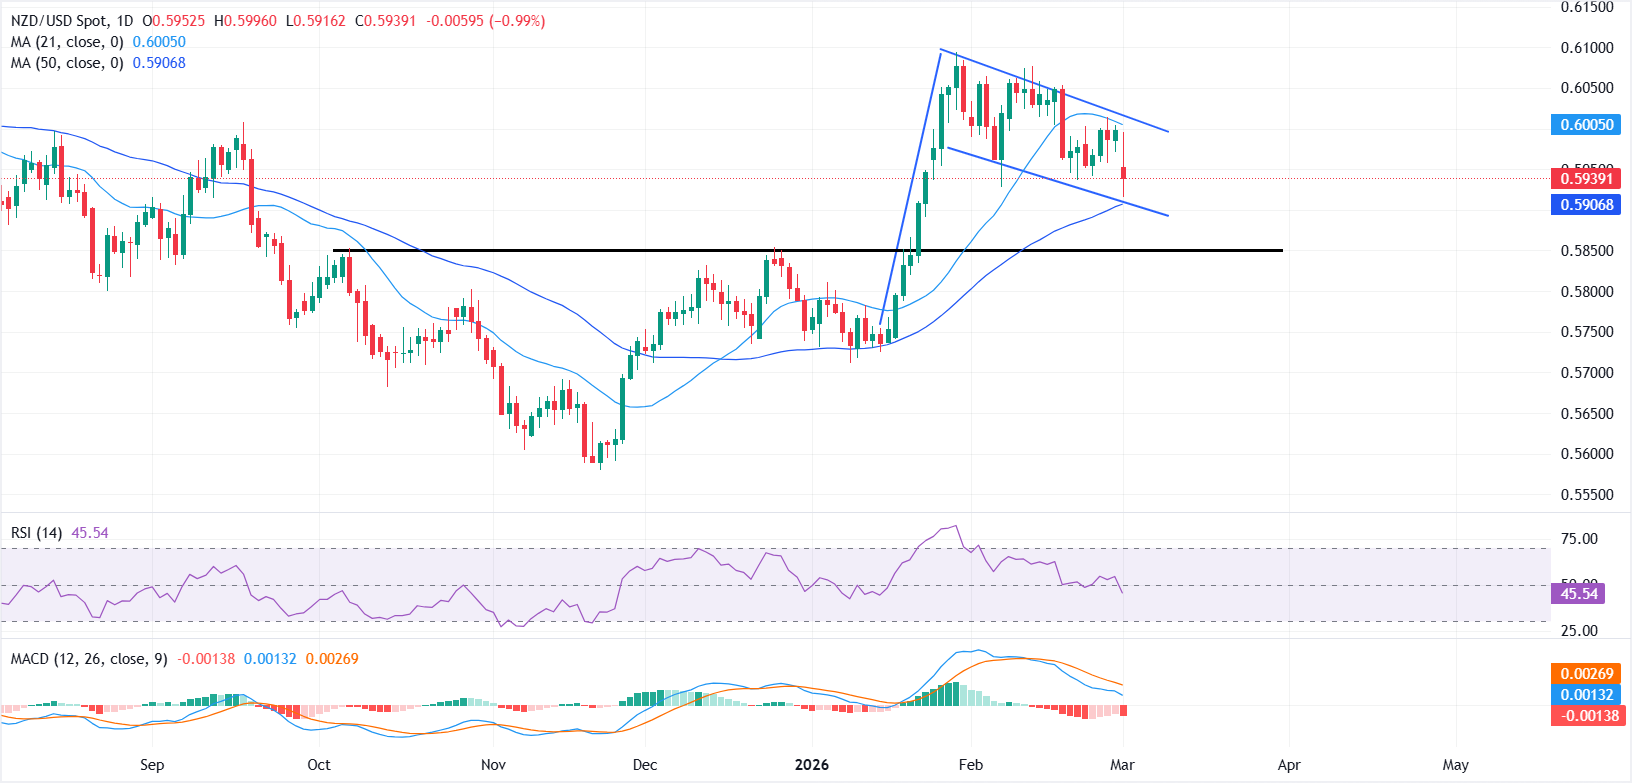
- Technical setup shows a corrective pullback within a broader bullish structure.

NZD/USD trades under pressure on Monday as the New Zealand Dollar (NZD) weakens against the US Dollar (USD) amid escalating geopolitical tensions in the Middle East.
At the time of writing, the pair is trading around 0.5939 after dipping to 0.5916 earlier in the day, its lowest level since January 23.
Safe-haven demand for the Greenback strengthens after the United States (US) and Israel launched joint strikes on Iran over the weekend, weighing on risk-sensitive currencies such as the Kiwi.
However, the NZD struggles to attract strong selling pressure as investors weigh monetary policy divergence between the Reserve Bank of New Zealand and the Federal Reserve (Fed).
Markets widely expect the Reserve Bank of New Zealand (RBNZ) to keep interest rates unchanged through most of 2026, though some economists see the possibility of another rate hike later in the year if the economic recovery strengthens and inflation remains sticky.
In contrast, markets still price in roughly 50 bps of Fed interest rate cuts in the second half of the year, though resilient economic data, a stabilising labour market and persistent inflation pressure have prompted traders to trim expectations for near-term monetary policy easing.
On the daily chart, the near-term bias is slightly bearish to neutral. NZD/USD is trading below the 21-day SMA near 0.6005, while still holding above the rising 50-day SMA around 0.5907, which continues to provide support.
Momentum indicators suggest a modest cooling in bullish pressure. The Relative Strength Index (RSI) has retreated from earlier overbought levels and is currently hovering near 45, pointing to weakening upside momentum.
Meanwhile, the Moving Average Convergence Divergence (MACD) remains below its signal line and beneath the zero level, with the histogram turning negative, reinforcing the developing downside bias in the near term.
Despite the pullback, the broader outlook remains constructive, with price action forming a bullish flag-and-pole pattern. A break above the 0.6000 psychological level, which aligns with the upper boundary of the flag, could trigger fresh upside momentum toward 0.6100 and beyond.
On the downside, a break below the 50-day SMA or the lower boundary of the flag would weaken the bullish structure and shift the bias lower, exposing 0.5850 as the first support, followed by 0.5700.
Author

Vishal Chaturvedi
FXStreet
I am a macro-focused research analyst with over four years of experience covering forex and commodities market. I enjoy breaking down complex economic trends and turning them into clear, actionable insights that help traders stay ahead of the curve.














