NZD/USD Price Forecast: Fails to extend three-day winning streak
- NZD/USD retraces to near 0.5650 after a three-day winning streak.
- Mounting NZ job market worries continue to weigh on the New Zealand Dollar.
- The US Dollar is broadly under pressure amid accelerating dovish Fed bets.

The NZD/USD pair corrects to near 0.5650 during the European trading session on Thursday after failing to extend its three-day winning streak. The Kiwi pair faces selling pressure as the New Zealand Dollar (NZD) underperforms across the board on expectations that the Reserve Bank of New Zealand (RBNZ) could cut interest rates further amid escalating job market concerns.
US Dollar Price Today
The table below shows the percentage change of US Dollar (USD) against listed major currencies today. US Dollar was the weakest against the Australian Dollar.
| USD | EUR | GBP | JPY | CAD | AUD | NZD | CHF | |
|---|---|---|---|---|---|---|---|---|
| USD | 0.06% | 0.10% | 0.12% | 0.07% | -0.24% | 0.36% | 0.18% | |
| EUR | -0.06% | 0.03% | 0.05% | 0.00% | -0.30% | 0.30% | 0.11% | |
| GBP | -0.10% | -0.03% | 0.02% | -0.03% | -0.33% | 0.27% | 0.08% | |
| JPY | -0.12% | -0.05% | -0.02% | -0.06% | -0.37% | 0.19% | 0.04% | |
| CAD | -0.07% | -0.01% | 0.03% | 0.06% | -0.29% | 0.28% | 0.11% | |
| AUD | 0.24% | 0.30% | 0.33% | 0.37% | 0.29% | 0.60% | 0.43% | |
| NZD | -0.36% | -0.30% | -0.27% | -0.19% | -0.28% | -0.60% | -0.18% | |
| CHF | -0.18% | -0.11% | -0.08% | -0.04% | -0.11% | -0.43% | 0.18% |
The heat map shows percentage changes of major currencies against each other. The base currency is picked from the left column, while the quote currency is picked from the top row. For example, if you pick the US Dollar from the left column and move along the horizontal line to the Japanese Yen, the percentage change displayed in the box will represent USD (base)/JPY (quote).
Last week, Statz NZ showed that the Unemployment Rate rose to 5.3% in the third quarter this year, as expected, the highest level seen in nine years.
Theoretically, deteriorating job market conditions force traders to raise bets supporting more interest rate cuts by the RBNZ.
Meanwhile, the US Dollar (USD) trades with caution as investors expect the Federal Reserve (Fed) to cut interest rates again this year. During the press time, the US Dollar Index (DXY), which tracks the Greenback’s value against six major currencies, trades near the 10-day low around 99.30.
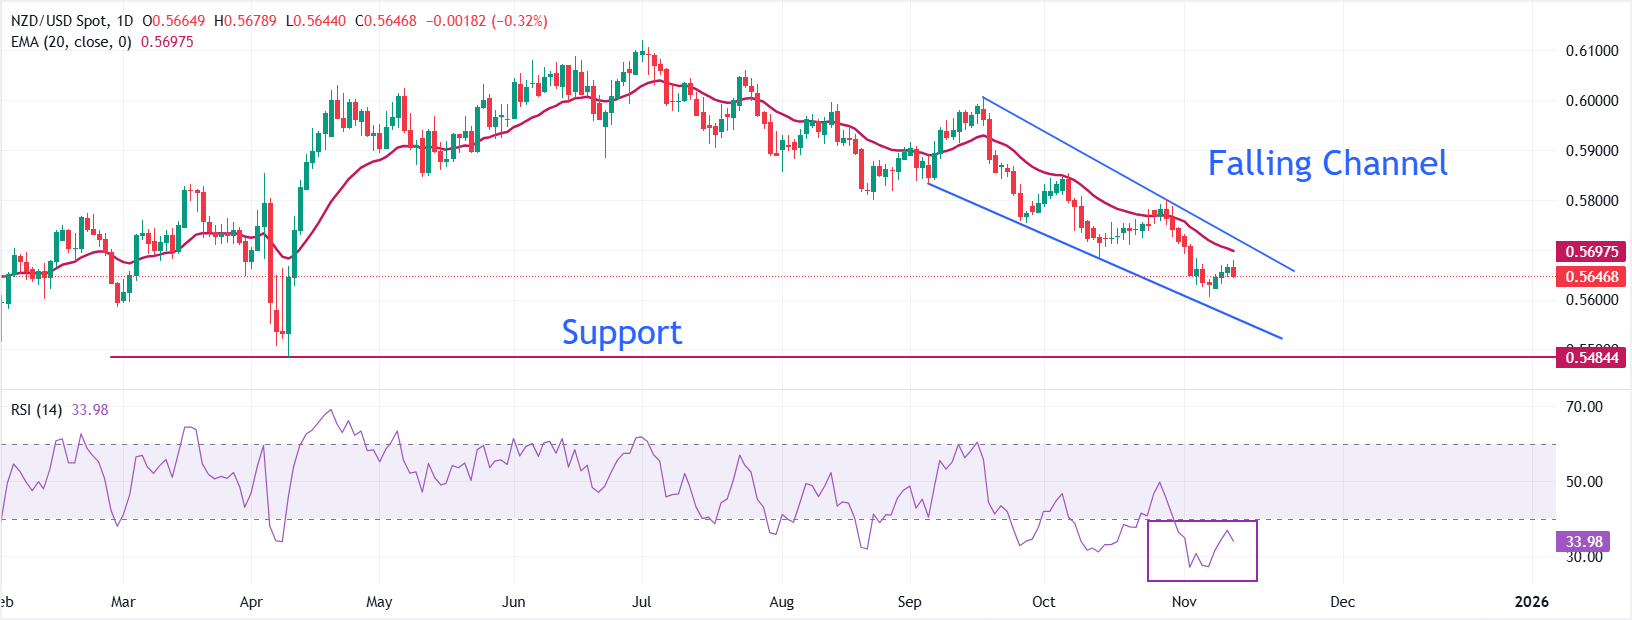
NZD/USD trades in a Falling Channel for two months, suggesting that the overall trend is bearish. The 20-day Exponential Moving Average (EMA) near 0.5700 is acting as a key barrier for NZD bulls.
The 14-day Relative Strength Index (RSI) stays below 40.00, suggesting a strong bearish momentum.
Going forward, the asset could slide towards the round-level support of 0.5600, and the April 9 low of 0.5485 if it breaks below the November 11 low of 0.5631.
In an alternate scenario, the Kiwi pair would rise towards the June 19 high of 0.6040 and the September 11 low of 0.6100 if it manages to break above the psychological level of 0.6000.
NZD/USD daily chart
US Dollar FAQs
The US Dollar (USD) is the official currency of the United States of America, and the ‘de facto’ currency of a significant number of other countries where it is found in circulation alongside local notes. It is the most heavily traded currency in the world, accounting for over 88% of all global foreign exchange turnover, or an average of $6.6 trillion in transactions per day, according to data from 2022. Following the second world war, the USD took over from the British Pound as the world’s reserve currency. For most of its history, the US Dollar was backed by Gold, until the Bretton Woods Agreement in 1971 when the Gold Standard went away.
The most important single factor impacting on the value of the US Dollar is monetary policy, which is shaped by the Federal Reserve (Fed). The Fed has two mandates: to achieve price stability (control inflation) and foster full employment. Its primary tool to achieve these two goals is by adjusting interest rates. When prices are rising too quickly and inflation is above the Fed’s 2% target, the Fed will raise rates, which helps the USD value. When inflation falls below 2% or the Unemployment Rate is too high, the Fed may lower interest rates, which weighs on the Greenback.
In extreme situations, the Federal Reserve can also print more Dollars and enact quantitative easing (QE). QE is the process by which the Fed substantially increases the flow of credit in a stuck financial system. It is a non-standard policy measure used when credit has dried up because banks will not lend to each other (out of the fear of counterparty default). It is a last resort when simply lowering interest rates is unlikely to achieve the necessary result. It was the Fed’s weapon of choice to combat the credit crunch that occurred during the Great Financial Crisis in 2008. It involves the Fed printing more Dollars and using them to buy US government bonds predominantly from financial institutions. QE usually leads to a weaker US Dollar.
Quantitative tightening (QT) is the reverse process whereby the Federal Reserve stops buying bonds from financial institutions and does not reinvest the principal from the bonds it holds maturing in new purchases. It is usually positive for the US Dollar.
Author

Sagar Dua
FXStreet
Sagar Dua is associated with the financial markets from his college days. Along with pursuing post-graduation in Commerce in 2014, he started his markets training with chart analysis.


