|

NZD/USD Price Analysis: Tests the psychological support of 0.6100 level

  • NZD/USD extends losses to the psychological support of 0.6100 on Friday.
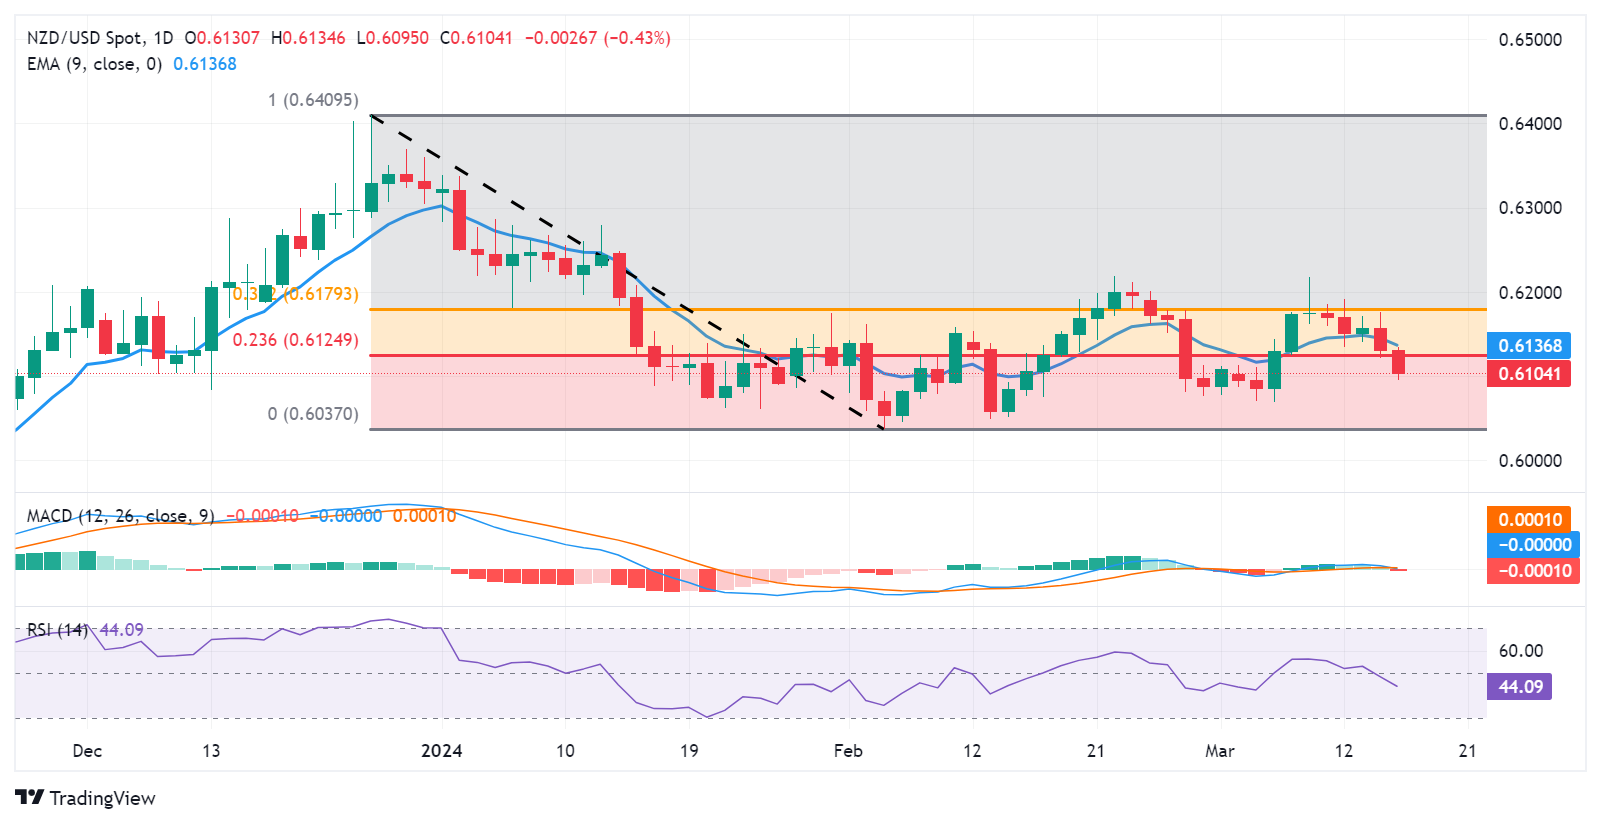
  • Technical analysis suggests a bearish momentum to revisit March’s low at 0.6068.
  • The key resistance zone appears around the 23.6% Fibonacci retracement level of 0.6124 and the nine-day EMA at 0.6137.

NZD/USD moves in the negative direction, extending its losses to near the psychological support of 0.6100 during the early European session on Friday. A decisive move below this level could exert downward pressure on the pair to navigate the area around March’s low at 0.6068 and a major support of 0.6050 level.

A break below the latter could lead the NZD/USD pair to revisit February’s low at 0.6037, followed by the psychological support at 0.6000. Traders will closely monitor these levels for potential shifts in market sentiment.

According to the Moving Average Convergence Divergence (MACD) analysis, a prevailing downward sentiment is indicated for the NZD/USD pair. The MACD line is positioned below both the centerline and the signal line, signaling a bearish trend. Additionally, the 14-day Relative Strength Index (RSI) is below the 50 level, providing further confirmation of the bearish sentiment.

On the upside, the NZD/USD pair could find a key barrier lies at the 23.6% Fibonacci retracement level at 0.6124, followed by the nine-day Exponential Moving Average (EMA) of 0.6137. The pair could face further resistance barriers if it climbs higher, with key levels anticipated at 0.6150, followed by the 38.2% Fibonacci retracement level of 0.6179.

NZD/USD: Daily Chart

NZD/USD

Overview
Today last price0.6107
Today Daily Change-0.0024
Today Daily Change %-0.39
Today daily open0.6131
 
Trends
Daily SMA200.6146
Daily SMA500.6139
Daily SMA1000.6122
Daily SMA2000.608
 
Levels
Previous Daily High0.6176
Previous Daily Low0.6121
Previous Weekly High0.6218
Previous Weekly Low0.6069
Previous Monthly High0.6219
Previous Monthly Low0.6037
Daily Fibonacci 38.2%0.6142
Daily Fibonacci 61.8%0.6155
Daily Pivot Point S10.6109
Daily Pivot Point S20.6088
Daily Pivot Point S30.6054
Daily Pivot Point R10.6164
Daily Pivot Point R20.6198
Daily Pivot Point R30.6219

Author

Akhtar Faruqui

Akhtar Faruqui is a Forex Analyst based in New Delhi, India. With a keen eye for market trends and a passion for dissecting complex financial dynamics, he is dedicated to delivering accurate and insightful Forex news and analysis.

More from Akhtar Faruqui
Share:

Markets move fast. We move first.

Orange Juice Newsletter brings you expert driven insights - not headlines. Every day on your inbox.

By subscribing you agree to our Terms and conditions.

Editor's Picks

EUR/USD moves sideways below 1.1800 on Christmas Eve

EUR/USD struggles to find direction and trades in a narrow channel below 1.1800 after posting gains for two consecutive days. Bond and stock markets in the US will open at the usual time and close early on Christmas Eve, allowing the trading action to remain subdued. 

GBP/USD keeps range around 1.3500 amid quiet markets

GBP/USD keeps its range trade intact at around 1.3500 on Wednesday. The Pound Sterling holds the upper hand over the US Dollar amid pre-Christmas light trading as traders move to the sidelines heading into the holiday season. 

Gold retreats from record highs, trades below $4,500

Gold retreats after setting a new record-high above $4,520 earlier in the day and trades in a tight range below $4,500 as trading volumes thin out ahead of the Christmas break. The US Dollar selling bias remains unabated on the back of dovish Fed expectations, which continues to act as a tailwind for the bullion amid persistent geopolitical risks.

Bitcoin slips below $87,000 as ETF outflows intensify, whale participation declines

Bitcoin price continues to trade around $86,770 on Wednesday, after failing to break above the $90,000 resistance. US-listed spot ETFs record an outflow of $188.64 million on Tuesday, marking the fourth consecutive day of withdrawals.

Economic outlook 2026-2027 in advanced countries: Solidity test

After a year marked by global economic resilience and ending on a note of optimism, 2026 looks promising and could be a year of solid economic performance. In our baseline scenario, we expect most of the supportive factors at work in 2025 to continue to play a role in 2026.

Avalanche struggles near $12 as Grayscale files updated form for ETF

Avalanche trades close to $12 by press time on Wednesday, extending the nearly 2% drop from the previous day. Grayscale filed an updated form to convert its Avalanche-focused Trust into an ETF with the US Securities and Exchange Commission.