|

NZD/USD Price Analysis: Tests the key barrier of 0.5950; next resistance at 14-day EMA

  • NZD/USD consolidates amid heightened geopolitical tensions after Iranian attack on Israel.
  • Technical analysis suggests a confirmation of a tepid momentum for the pair.
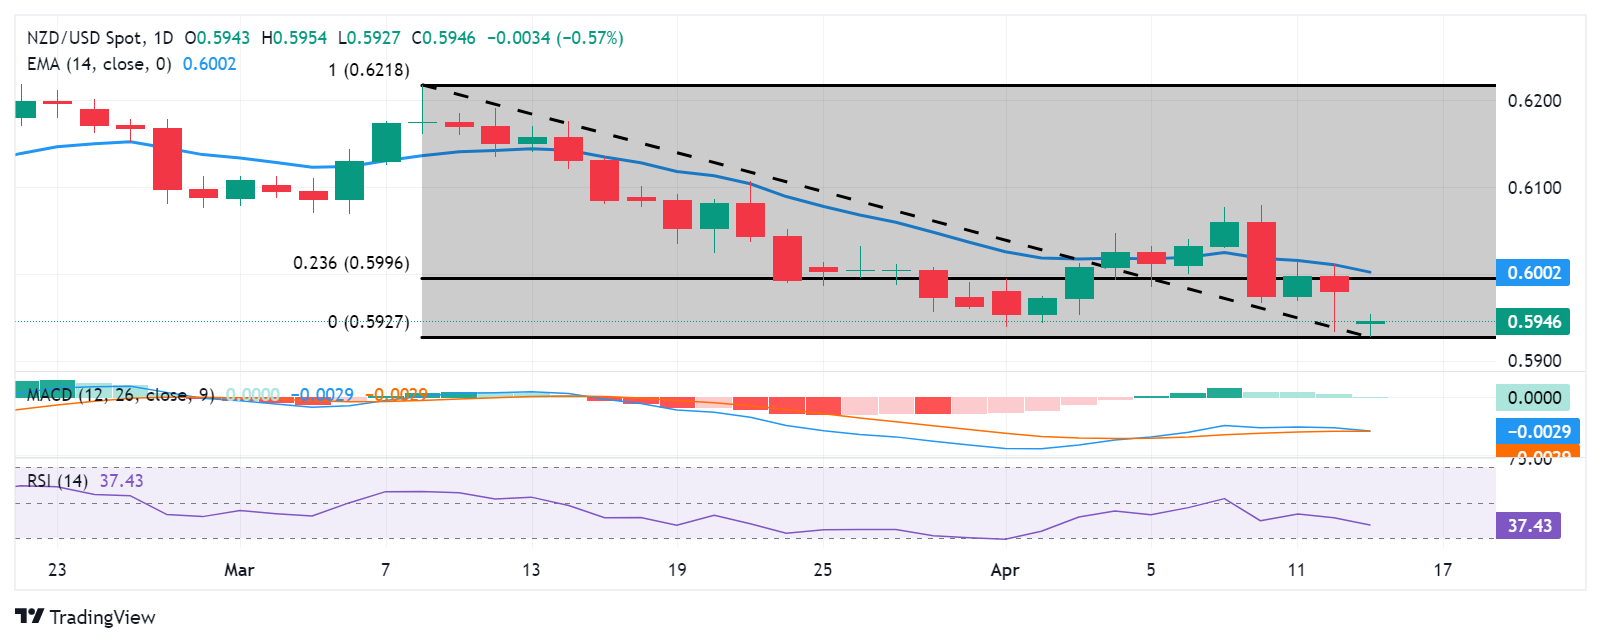
  • The level of 0.5950 appears as the immediate barrier followed by the 23.6% Fibo level of 0.5996 and the psychological level of 0.6000.

NZD/USD moves back and forth amid heightened geopolitical tensions in the Middle East after Iran attacked potential Israel military on Saturday by launching explosive drones and missiles targeting military installations in Israel. However, Israel successfully intercepted most of the incoming projectiles, according to Reuters. The NZD/USD pair consolidates around 0.5940 during the European session on Monday.

According to the Moving Average Convergence Divergence (MACD) analysis, a prevailing downward sentiment is indicated for the NZD/USD pair. This is evidenced by the MACD line positioned below the centerline and the signal line, signaling a bearish trend.

Furthermore, the 14-day Relative Strength Index (RSI) is below the 50 level, providing additional confirmation of the bearish sentiment, which could prompt traders of the NZD/USD pair to navigate the region around the psychological level of 0.5900. A break below the latter could influence the NZD/USD pair to approach further support at the major level of 0.5850.

On the upside, the NZD/USD pair could find immediate resistance at the major level of 0.5950. A breakthrough above this level could lead the pair to test a strong resistance area around the 23.6% Fibonacci retracement level of 0.5996, aligned with the psychological level of 0.6000 and 14-day Exponential Moving Average (EMA) of 0.6001.

NZD/USD: Daily Chart

NZD/USD

Overview
Today last price0.5945
Today Daily Change-0.0035
Today Daily Change %-0.59
Today daily open0.598
 
Trends
Daily SMA200.6011
Daily SMA500.6082
Daily SMA1000.6136
Daily SMA2000.6065
 
Levels
Previous Daily High0.6011
Previous Daily Low0.5933
Previous Weekly High0.6079
Previous Weekly Low0.5933
Previous Monthly High0.6218
Previous Monthly Low0.5956
Daily Fibonacci 38.2%0.5963
Daily Fibonacci 61.8%0.5981
Daily Pivot Point S10.5938
Daily Pivot Point S20.5897
Daily Pivot Point S30.586
Daily Pivot Point R10.6016
Daily Pivot Point R20.6053
Daily Pivot Point R30.6094

Author

Akhtar Faruqui

Akhtar Faruqui is a Forex Analyst based in New Delhi, India. With a keen eye for market trends and a passion for dissecting complex financial dynamics, he is dedicated to delivering accurate and insightful Forex news and analysis.

More from Akhtar Faruqui
Share:

Editor's Picks

EUR/USD remains offered below 1.1600, seems vulnerable near multi-month low

The EUR/USD pair struggles to capitalize on the overnight bounce from the 1.1530 region, or the lowest level since November 2025, and lower for the third consecutive day on Wednesday. Spot prices slide back below the 1.1600 mark during the Asian session and seem vulnerable to slide further.

GBP/USD weakens to near 1.3300 as geopolitical risks bolster US Dollar

The GBP/USD pair attracts some sellers to around 1.3310 during the early European session on Wednesday. Escalating conflict in the Middle East triggers a "flight to safety," supporting the US Dollar against the Pound Sterling. Traders will take more cues from the US ADP Employment and ISM Services Purchasing Managers Index reports, which are due later on Wednesday. 

Gold sticks to intraday gains above $5,150; upside seems limited amid bullish USD

Gold preserves its modest intraday gains through the Asian session on Wednesday and currently trades just above the $5,150 level, up around 1.30% for the day. Investors remain concerned about a prolonged conflict in the Middle East and its impact on the global economy amid an already uncertain environment. 

Bitcoin, Ethereum and Ripple struggle for direction as consolidation persists

Bitcoin, Ethereum and Ripple prices trade with a cautious tone at the time of writing on Wednesday as upside momentum continues to fade across the broader crypto market. BTC remains within a parallel channel, ETH struggles below key resistance, while XRP remains fragile within a descending channel. These top three cryptocurrencies by market capitalization continue to struggle to establish a directional bias amid the consolidation phase.

When rates start driving the bus through a war zone

The volatility regime itself is also changing character. EM carry trades thrive in calm markets. They suffocate in environments that resemble Buckaroo Banzai trading conditions, where headlines move faster than models. That is exactly the world investors are now trying to recalibrate to. Euro rate volatility had been remarkably subdued even while equities were wobbling. That stability is now being questioned, and once volatility leaks into rates it rarely stays contained. Indeed, carry trades love calm seas. War turns the ocean into white water.

Ripple falters amid sell-off jitters and negative funding rates

Ripple (XRP) has come under pressure, drifting lower to $1.35 at the time of writing on Tuesday. The over 2% correction looks poised to erase the previous day’s gains, which lifted the remittance token to $1.42.