NZD/USD Price Analysis: Sellers break weekly support line to attack 0.6700
- NZD/USD snaps four-day winning streak after RBNZ comments.
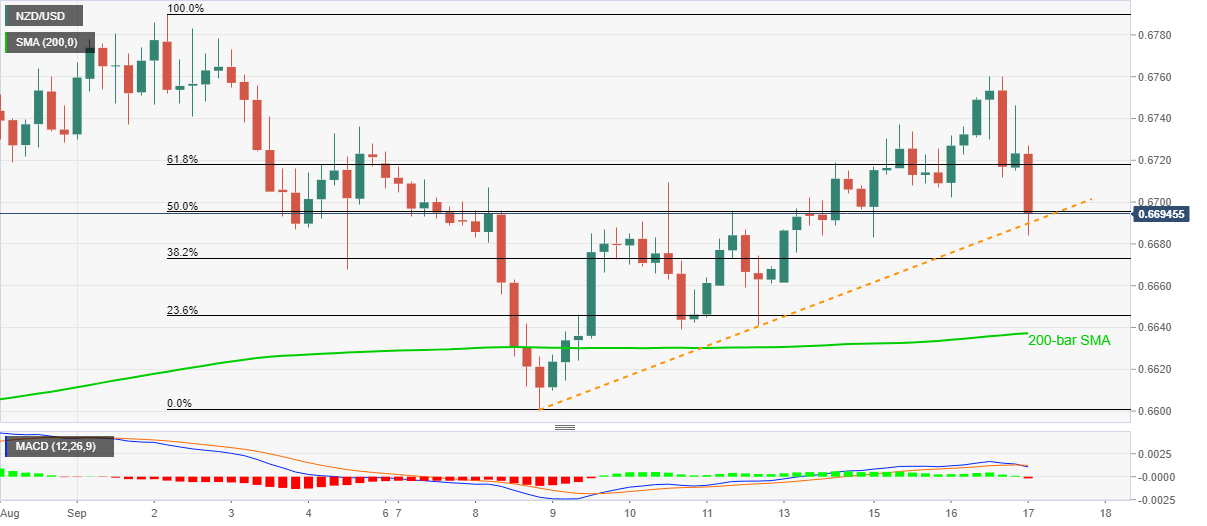
- MACD turns the most bearish in a week as sellers dominate below the key Fibonacci retracement levels.
- 200-bar SMA on the bears’ radar, 0.6800 can lure the bulls during the fresh rise.

NZD/USD drops to 0.6693, down 0.58% intraday, after RBNZ’s stress test conveyed the severity of coronavirus (COVID-19) led economic conditions during early Thursday. In doing so, the pair broke an ascending trend line from September 08 while slipping below 61.8% and 50% of the Fibonacci retracement of September 02-08 downside.
Read: Banks stress test outcome reinforces need tor strong capital buffers - RBNZ
As a result, the sellers are preparing to revisit a 200-bar SMA level of 0.6637 before targeting the monthly low near 0.6600.
However, an extended break of the trend line, at 0.6689 now, becomes necessary to confirm NZD/USD weakness.
Meanwhile, the key Fibonacci retracement levels can offer immediate resistances around 0.6695 and 0.6720 ahead of the recent high near 0.6760.
Though, any further upside past-0.6760 will depends upon how well the bulls manage to cross the monthly high of 0.6790 and remain strong beyond the 0.6800 threshold.
NZD/USD four-hour chart
Trend: Bearish
Author

Anil Panchal
FXStreet
Anil Panchal has nearly 15 years of experience in tracking financial markets. With a keen interest in macroeconomics, Anil aptly tracks global news/updates and stays well-informed about the global financial moves and their implications.


