|

NZD/USD Price Analysis: Retreats from monthly top towards 0.6200 on downbeat NZ PMI

  • NZD/USD eases from three-week high to print the first daily loss, so far, in four days.
  • Business NZ PMI marks activity contraction for the third consecutive month in June.
  • 100-DMA, previous resistance line join bullish MACD signals to favor Kiwi buyers.

NZD/USD takes offers to refresh intraday low around 0.6230 amid the early hours of Friday’s Asian session. In doing so, the Kiwi pair takes a U-turn from the highest levels since May 24, marked the previous day, while also snapping a three-day uptrend, amid downbeat New Zealand (NZ) data.

NZ Business PMI for June came in at 48.9 versus 50.2 expected and 49.1 prior. With this, the Pacific nation’s activity gauge marked the third consecutive monthly contraction in business performance.

Not only the downbeat NZ data but the above 50.0 levels of the RSI (14) line also allowed the NZD/USD bulls to take a breather at the multi-day high.

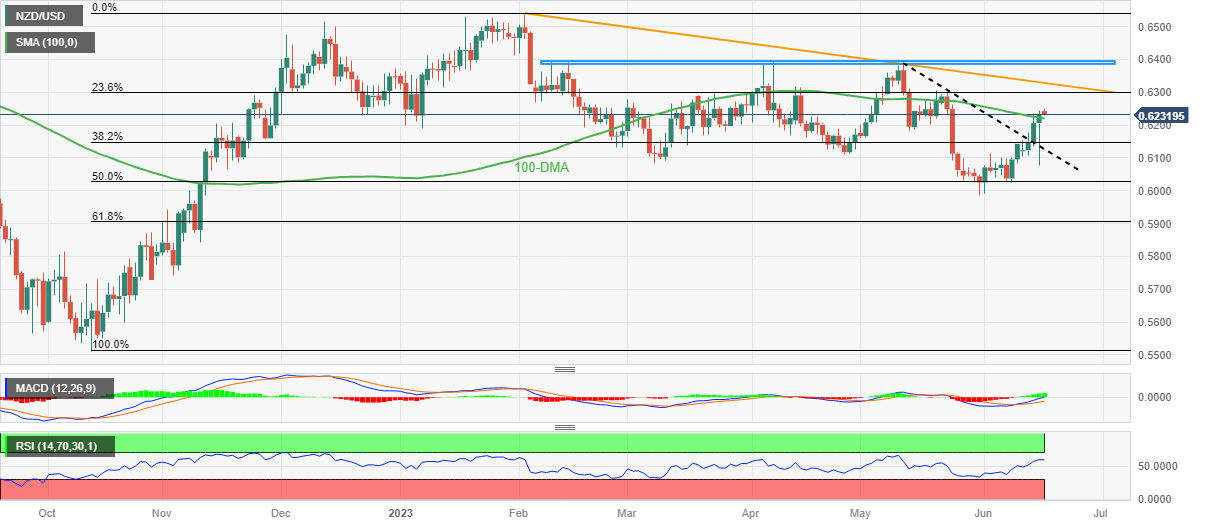
However, the 100-DMA support of around 0.6220 joins the bullish MACD signals to put a floor under the NZD/USD price for intraday traders, a break of which can quickly drag the quote to the 38.2% Fibonacci retracement of October 2022 to February 2023 upside, near 0.6150.

Following that, the resistance-turned-support line stretched from early May, around 0.6120 at the latest, will be in the spotlight.

In a case where the NZD/USD drops below 0.6120 support, the odds of witnessing a south-run towards the previous monthly low of around 0.5985 can’t be ruled out.

Meanwhile, the NZD/USD buyers can aim for the 23.6% Fibonacci retracement level of around 0.6300 on crossing the latest peak of 0.6250.

Though, a 4.5-month-old resistance line and a horizontal area comprising multiple levels marked since early February, respectively near 0.6330 and 0.6385-90, appear tough nuts to crack for the Kiwi pair buyers to keep the reins afterward.

NZD/USD: Daily chart

Trend: Limited downside expected

Additional important levels

Overview
Today last price0.6232
Today Daily Change0.0026
Today Daily Change %0.42%
Today daily open0.6206
 
Trends
Daily SMA200.6113
Daily SMA500.6179
Daily SMA1000.6224
Daily SMA2000.615
 
Levels
Previous Daily High0.6236
Previous Daily Low0.6133
Previous Weekly High0.6143
Previous Weekly Low0.6026
Previous Monthly High0.6385
Previous Monthly Low0.5985
Daily Fibonacci 38.2%0.6197
Daily Fibonacci 61.8%0.6173
Daily Pivot Point S10.6147
Daily Pivot Point S20.6089
Daily Pivot Point S30.6044
Daily Pivot Point R10.6251
Daily Pivot Point R20.6295
Daily Pivot Point R30.6354

Author

Anil Panchal

Anil Panchal

FXStreet

Anil Panchal has nearly 15 years of experience in tracking financial markets. With a keen interest in macroeconomics, Anil aptly tracks global news/updates and stays well-informed about the global financial moves and their implications.

More from Anil Panchal
Share:

Editor's Picks

EUR/USD weakens below 1.1700 as Middle East tensions drive US Dollar strength

The EUR/USD pair trades with mild losses around 1.1685, the lowest since late January, during the early Asian session on Tuesday. The US Dollar gathers strength against the Euro as escalating tensions in the Middle East boost safe-haven currencies. The preliminary reading of the Harmonized Index of Consumer Prices from the Eurozone will be published later on Tuesday.  

GBP/USD hits new yearly lows near 1.3300

GBP/USD adds to the recent bearish tone, approaching to the key 1.3300 support to reach fresh YTD troughs against the backdrop of the robust performance of the US Dollar. Indeed, Cable’s decline comes amid the firm demand for the safe-haven space in the wake of the US and Israel attacks to Iran.

Gold defends bids as US-Iran war continues to fuel safe-haven flows

Gold retains positive bias for the fifth consecutive day on Tuesday as rising geopolitical tensions in the Middle East continue to underpin safe-haven assets. However, a bullish US Dollar keeps the bullion below its highest level since late January, set on Monday, warranting caution before positioning for any further appreciation.

Strategy lifts holdings to 3.4% of Bitcoin's total supply amid inflows into crypto products

Strategy continued its accumulation of the top crypto last week, acquiring 3,015 BTC for $204 million amid renewed interest in crypto products after four weeks of outflows.

The market is not panicking it is repricing the probability distribution of Oil and time

At the end of the day, markets do not trade morality or geopolitics. They trade transmission channels. And the only channel that truly matters in this maelstrom runs through the price of energy and the time value of money.

Grass 20% bullish breakout defies broader market weakness

Grass (GRASS) is edging up above $0.30 at the time of writing on Monday. The token’s notable 20% intraday surge stands out amid heightened volatility in the broader crypto market.