NZD/USD Price Analysis: Overbought RSI conditions probe bull above 0.6400
- NZD/USD recovers the early-day losses to print mild gains around 0.6425/20.
- A horizontal line including March month top and Wednesday’s high questions the bulls.
- 200-day SMA, 61.8% Fibonacci retracement restrict the pair’s near-term declines.

NZD/USD recovers from intraday low of 0.6404 to 0.6427, up 0.15% on a day, during the pre-European session on Thursday. Even so, the kiwi pair’s further upside is likely doubtful amid overbought RSI conditions.
Also read: NZ Foreign Minister: July likely too early to resume travel with Australia
Other than the aforementioned horizontal resistance area near 0.6445/50, February month high near 0.6500 also stands ready to challenge the additional rise.
Meanwhile, sellers may target a 200-day SMA level near 0.6315 during a fresh downside. Though 61.8% Fibonacci retracement of December 31, 2019, to March 19, 2020 fall, around 0.6265 could limit the pair’s extra declines.
If at all the bears remain dominant past-0.6265, April month high near 0.6175 might return to the charts.
NZD/USD daily chart
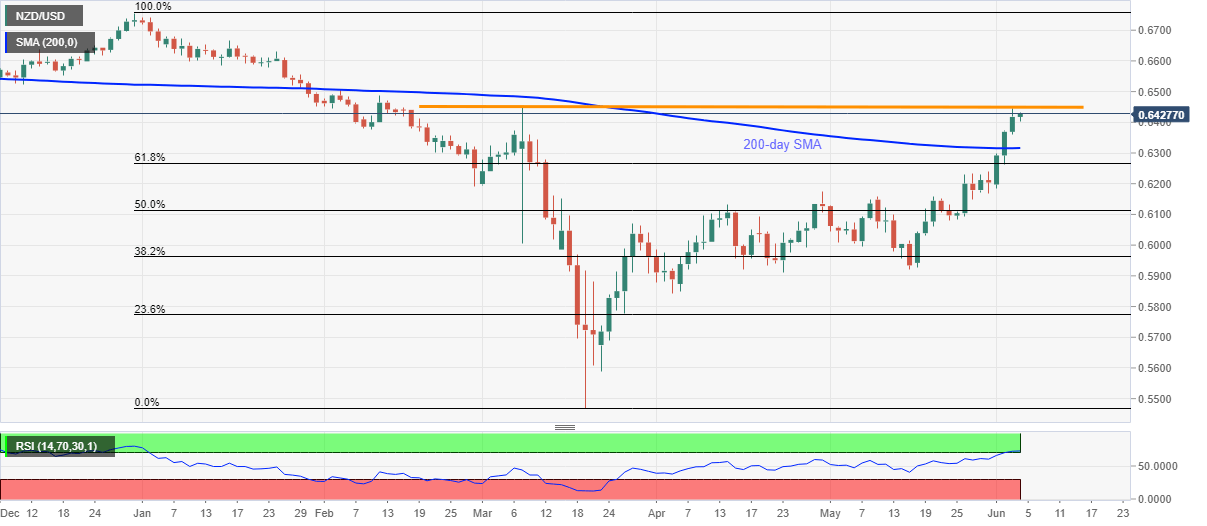
Trend: Pullback expected
Author

Anil Panchal
FXStreet
Anil Panchal has nearly 15 years of experience in tracking financial markets. With a keen interest in macroeconomics, Anil aptly tracks global news/updates and stays well-informed about the global financial moves and their implications.


