|

NZD/USD Price Analysis: Maintains its position below 0.6000 ahead of US jobs data

  • NZD/USD consolidates below the psychological level before US Jobless Claims.
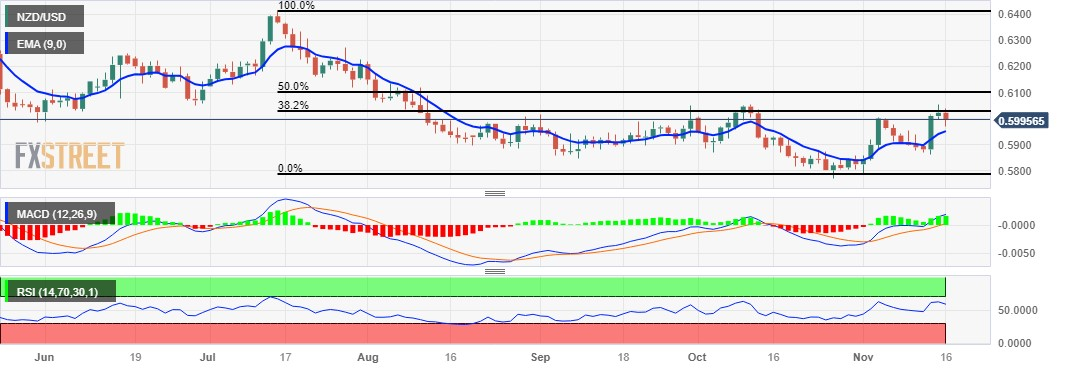
  • Nine-day EMA at 0.5952 could act as the key support aligned to the 0.5950 major level.
  • 38.2% Fibo at 0.6025 emerges as the barrier followed by the major level at 0.6050.

NZD/USD retreats from the weekly high, hovering below the 0.6000 psychological level during the European hours on Thursday. The NZD/USD pair could find support at the nine-day Exponential Moving Average (EMA) at 0.5952 lined up with a major level at 0.5950.

A decisive break below the level could influence the bears of the NZD/USD pair to navigate the region around 0.5900 psychological level following the two-week low at 0.5859.

However, the technical indicators for the NZD/USD pair do indeed paint a bullish picture. The 14-day Relative Strength Index (RSI) being above the 50 level signals upward support, indicating a strong momentum in favor of the pair.

Moreover, the Moving Average Convergence Divergence (MACD) line, positioned above the centerline and showing divergence above the signal line, further suggests a bullish momentum in the NZD/USD pair.

On the upside, the 38.2% Fibonacci retracement at 0.6025 appears to be the immediate resistance. A firm breakthrough above the latter could support the NZD/USD pair to explore the region around the major level at 0.6050 followed by the 50% retracement at 0.6099 level.

NZD/USD: Daily Chart

NZD/USD: More technical levels

Overview
Today last price0.6001
Today Daily Change-0.0021
Today Daily Change %-0.35
Today daily open0.6022
 
Trends
Daily SMA200.5886
Daily SMA500.5916
Daily SMA1000.6002
Daily SMA2000.6101
 
Levels
Previous Daily High0.6055
Previous Daily Low0.5996
Previous Weekly High0.6002
Previous Weekly Low0.5877
Previous Monthly High0.6056
Previous Monthly Low0.5772
Daily Fibonacci 38.2%0.6033
Daily Fibonacci 61.8%0.6019
Daily Pivot Point S10.5994
Daily Pivot Point S20.5966
Daily Pivot Point S30.5935
Daily Pivot Point R10.6053
Daily Pivot Point R20.6083
Daily Pivot Point R30.6112

Author

Akhtar Faruqui

Akhtar Faruqui is a Forex Analyst based in New Delhi, India. With a keen eye for market trends and a passion for dissecting complex financial dynamics, he is dedicated to delivering accurate and insightful Forex news and analysis.

More from Akhtar Faruqui
Share:

Editor's Picks

EUR/USD appears supported by the 200-day SMA, for now

Following an early pullback to multi-week lows near 1.1670, EUR/USD now manages to reclaim the 1.1700 region as the NA session draws to a close on Monday. The steep retracement in spot follows the equally strong move higher in the US Dollar, as investors continue to assess the geopolitical landscape in the wake of the US and Israel attacks on Iran.


GBP/USD hits new yearly lows near 1.3300

GBP/USD adds to the recent bearish tone, approaching to the key 1.3300 support to reach fresh YTD troughs against the backdrop of the robust performance of the US Dollar. Indeed, Cable’s decline comes amid the firm demand for the safe-haven space in the wake of the US and Israel attacks to Iran.

Gold eases some ground, approaches $5,300

Gold now surrenders part of the earlier advance, reshifting its attenton to the $5,300 zone per troy ounce at the beginning of the week. Indeed, the yellow metal’s firm performance appears propped up by incresing geopolitical jitters in the Middle East, which at the same time fuels the demand for the safe-haven space.

Strategy lifts holdings to 3.4% of Bitcoin's total supply amid inflows into crypto products

Strategy continued its accumulation of the top crypto last week, acquiring 3,015 BTC for $204 million amid renewed interest in crypto products after four weeks of outflows.

The Fed is finally talking about AI – Here's why it matters for the US Dollar

AI is moving from earnings calls into the heart of monetary policy discussions, forcing Federal Reserve officials to confront a new question: How to act if AI reshapes inflation, employment and interest rates at the same time?

Grass 20% bullish breakout defies broader market weakness

Grass (GRASS) is edging up above $0.30 at the time of writing on Monday. The token’s notable 20% intraday surge stands out amid heightened volatility in the broader crypto market.