|

NZD/USD Price Analysis: Kiwi stretches gains near 0.59 but momentum signals caution

  • NZD/USD trades near the 0.5900 zone following another daily push higher
  • MACD supports bullish bias, while RSI flirts with overbought territory
  • Key moving averages continue to underpin the pair’s upward trajectory

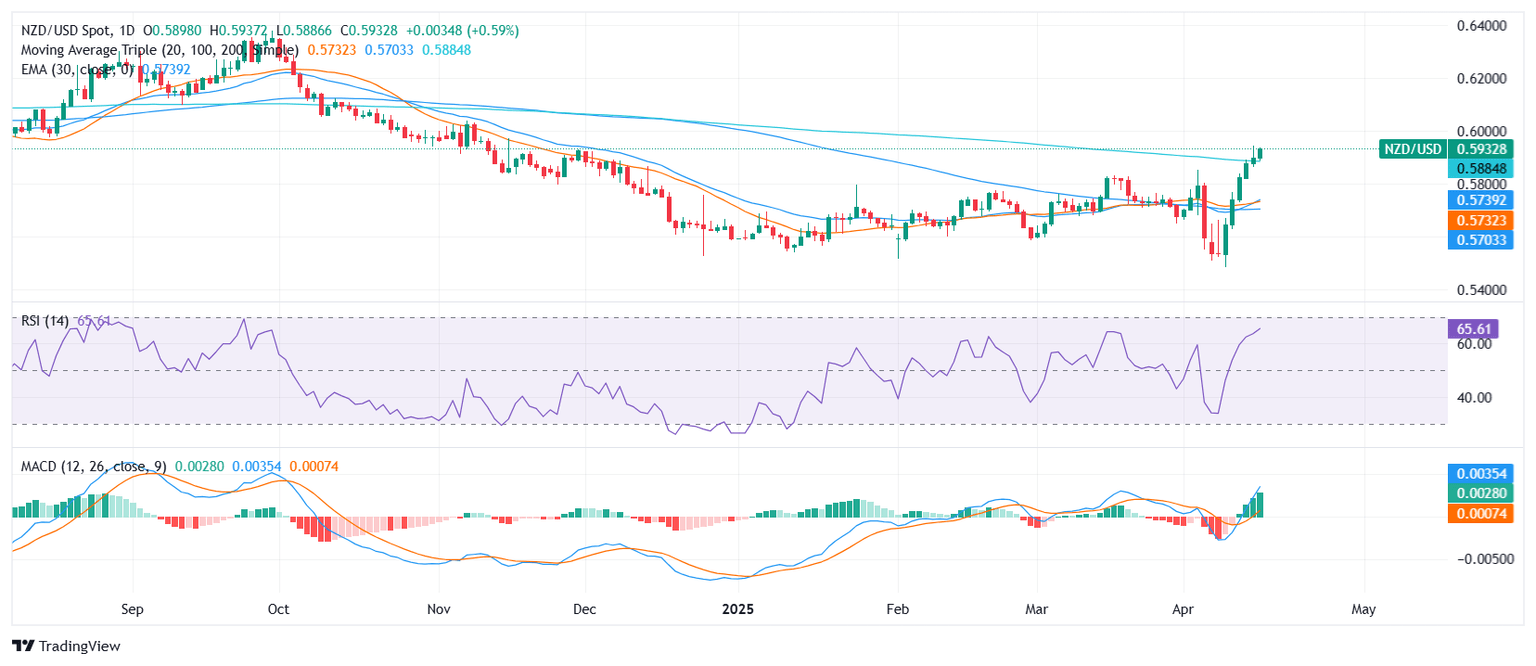
The NZD/USD pair advanced for a third session on Wednesday, holding near the 0.5900 region ahead of the Asian session. The pair saw modest gains and remained confined within a relatively tight range between 0.58865 and 0.59308, suggesting a steady bullish tone.

From a technical perspective, the broader bias remains positive. The MACD prints a buy signal, confirming continued bullish momentum. The Relative Strength Index (RSI) stands at 65.16, edging close to overbought conditions but still neutral. Similarly, the Awesome Oscillator and the Average Directional Index (ADX) remain flat, hinting that the current uptrend lacks strong conviction.

Still, the backdrop remains supportive of further gains. All major moving averages — including the 20-day SMA at 0.57318, the 100-day at 0.57083, and the 200-day at 0.58897 — are aligned in favor of buyers. The 10-day EMA (0.57905) and SMA (0.57374) also reinforce this structure, helping the pair sustain its recent upside.

Immediate support is found at 0.58897, followed by 0.58421 and 0.57905. On the upside, bulls may target resistance around 0.59666 if momentum strengthens.

Daily chart

Author

Patricio Martín

Patricio is an economist from Argentina passionate about global finance and understanding the daily movements of the markets.

More from Patricio Martín
Share:

Markets move fast. We move first.

Orange Juice Newsletter brings you expert driven insights - not headlines. Every day on your inbox.

By subscribing you agree to our Terms and conditions.

Editor's Picks

EUR/USD: Bulls pray for a dovish Fed

EUR/USD has finally taken a breather after a pretty energetic climb. The pair broke above 1.1680 in the second half of the week, reaching its highest levels in around two months before running into some selling pressure. Even so, it has gained almost two cents from the late-November dip just below 1.1500 the figure.

GBP/USD trims gains, recedes toward 1.3320

GBP/USD is struggling to keep its daily advance, coming under fresh pressure and retreating to the 1.3320 zone following a mild bullish attempt in the Greenback. Even though US consumer sentiment surprised to the upside, the US Dollar isn’t getting much love, as traders are far more interested in what the Fed will say next week.

Gold: Bullish momentum fades despite broad USD weakness

After rising more than 3.5% in the previous week, Gold has entered a consolidation phase and fluctuated at around $4,200. The Federal Reserve’s interest rate decision and revised Summary of Economic Projections, also known as the dot plot, could trigger the next directional move in XAU/USD. 

Week ahead: Rate cut or market shock? The Fed decides

Fed rate cut widely expected; dot plot and overall meeting rhetoric also matter. Risk appetite is supported by Fed rate cut expectations; cryptos show signs of life. RBA, BoC and SNB also meet; chances of surprises are relatively low. Dollar weakness could linger; both the aussie and the yen best positioned to gain further. Gold and oil eye Ukraine-Russia developments; a peace deal remains elusive.

Week ahead – Rate cut or market shock? The Fed decides

Fed rate cut widely expected; dot plot and overall meeting rhetoric also matter. Risk appetite is supported by Fed rate cut expectations; cryptos show signs of life. RBA, BoC and SNB also meet; chances of surprises are relatively low.

Ripple faces persistent bear risks, shrugging off ETF inflows

Ripple is extending its decline for the second consecutive day, trading at $2.06 at the time of writing on Friday. Sentiment surrounding the cross-border remittance token continues to lag despite steady inflows into XRP spot ETFs.