|

NZD/USD Price Analysis: Kiwi rebound eyes 0.6150 and NZ/US inflation clues

  • NZD/USD defends previous recovery from the key Fibonacci retracement level, clings to mild gains of late.
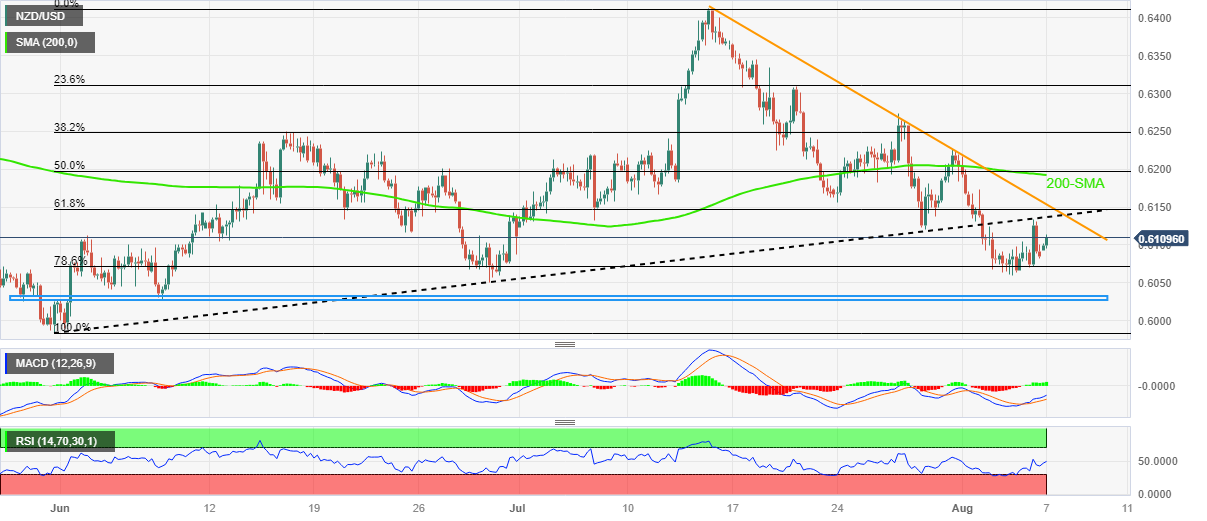
  • Upside oscillators favor recovery towards previous support line.
  • Three-week-old falling resistance line, 200-SMA challenge Kiwi buyers.
  • Kiwi sellers need validation from multi-day-old horizontal support zone, RBNZ Inflation Expectations and US CPI.

NZD/USD renews its intraday high near 0.6115 as it extends the previous run-up during the mid-Asian session on Monday. In doing so, the Kiwi pair justifies the US Dollar’s struggle ahead of this week’s US Consumer Price Index (CPI) data while also cheering the optimism ahead of the Reserve Bank of New Zealand’s Inflation Expectations for the third quarter (Q3) of 2023.

That said, the bullish MACD signals and upbeat RSI (14) line, not overbought, favor the quote’s recovery moves from the 78.6% Fibonacci retracement of the May-July upside.

With this, the NZD/USD bulls appear well-set to challenge the previous support line stretched from May 31, close to 0.6140 by the press time.

Following that, the 61.8% Fibonacci retracement and a downward-sloping resistance line from July 14, respectively ear 0.6145 and 0.6150, will challenge the Kiwi buyers before giving them control.

Even so, the 200-SMA around 0.6195 and the 0.6200 round figure will act as the final defense of the NZD/USD bears.

On the flip side, the aforementioned 78.6% Fibonacci retracement puts a floor under the NZD/USD prices near 0.6070.

In a case where the Kiwi pair breaks the 0.6070 support, a horizontal region comprising multiple levels marked since late May, around 0.6030, could test the NZD/USD bears before directing them to the 0.6000 psychological magnet and the yearly low marked in May around 0.5985.

NZD/USD: Four-hour chart

Trend: Limited recovery expected

Additional important levels

Overview
Today last price0.611
Today Daily Change0.0026
Today Daily Change %0.43%
Today daily open0.6084
 
Trends
Daily SMA200.6215
Daily SMA500.6165
Daily SMA1000.6193
Daily SMA2000.6228
 
Levels
Previous Daily High0.6133
Previous Daily Low0.607
Previous Weekly High0.6226
Previous Weekly Low0.606
Previous Monthly High0.6413
Previous Monthly Low0.612
Daily Fibonacci 38.2%0.6109
Daily Fibonacci 61.8%0.6094
Daily Pivot Point S10.6058
Daily Pivot Point S20.6033
Daily Pivot Point S30.5995
Daily Pivot Point R10.6122
Daily Pivot Point R20.6159
Daily Pivot Point R30.6185

Author

Anil Panchal

Anil Panchal

FXStreet

Anil Panchal has nearly 15 years of experience in tracking financial markets. With a keen interest in macroeconomics, Anil aptly tracks global news/updates and stays well-informed about the global financial moves and their implications.

More from Anil Panchal
Share:

Markets move fast. We move first.

Orange Juice Newsletter brings you expert driven insights - not headlines. Every day on your inbox.

By subscribing you agree to our Terms and conditions.

Editor's Picks

EUR/USD recovers to 1.1750 region as 2025 draws to a close

Following the bearish action seen in the European session on Wednesday, EUR/USD regains its traction and recovery to the 1.1750 region. Nevertheless, the pair's volatility remains low as trading conditions thin out on the last day of the year.

GBP/USD stays weak near 1.3450 on modest USD recovery

GBP/USD remains under modest beairsh pressure and fluctuates at around 1.3450 on Wednesday. The US Dollar finds fresh demand due to the end-of-the-year position adjustments, weighing on the pair amid the pre-New Year trading lull. 

Gold retreats to $4,300 area, looks to post monthly gains

Gold stays on the back foot on the last day of 2025 and trades near $4,300, possibly pressured by profit-taking and position adjustments. Nevertheless, XAU/USD remains on track to post gains for December and extend its winning streak into a fifth consecutive month.

Bitcoin, Ethereum and XRP prepare for a potential New Year rebound

Bitcoin, Ethereum, and Ripple are holding steady on Wednesday after recording minor gains on the previous day. Technically, Bitcoin could extend gains within a triangle pattern while Ethereum and Ripple face critical overhead resistance. 

Economic outlook 2026-2027 in advanced countries: Solidity test

After a year marked by global economic resilience and ending on a note of optimism, 2026 looks promising and could be a year of solid economic performance. In our baseline scenario, we expect most of the supportive factors at work in 2025 to continue to play a role in 2026.

Crypto market outlook for 2026

Year 2025 was volatile, as crypto often is.  Among positive catalysts were favourable regulatory changes in the U.S., rise of Digital Asset Treasuries (DAT), adoption of AI and tokenization of Real-World-Assets (RWA).