|

NZD/USD Price Analysis: Further downside towards 0.6030 appears imminent

  • NZD/USD remains on the back foot at the lowest levels in three weeks.
  • Kiwi bears stay hopeful amid Clear break of monthly support line, bearish MACD signals.
  • 50% Fibonacci retracement appears nearby target for sellers.
  • Bulls need to refresh the monthly peak to retake control.

NZD/USD holds onto the previous day’s bearish bias despite posting mild intraday gains around 0.6080 heading into Thursday’s European session.

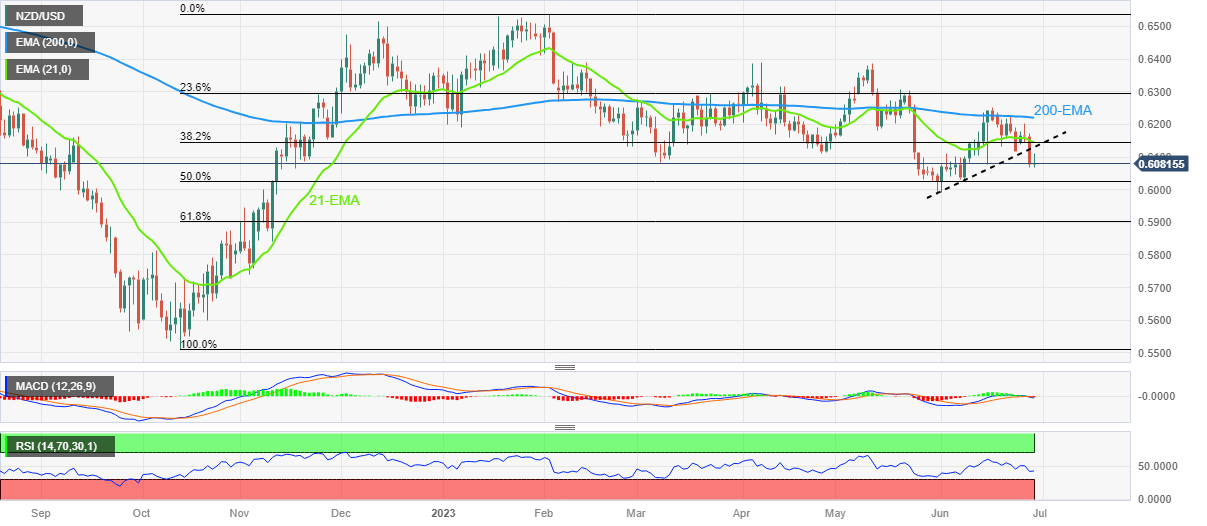
In doing so, the Kiwi pair justifies the downside break of an ascending support line from May 31, now immediate resistance around 0.6140. Also adding strength to the downside bias are the bearish MACD signals and the quote’s sustained trading below the 21-day Exponential Moving Average (EMA), near 0.6145 at the latest.

With this, the NZD/USD bears are well-set to poke the 50% Fibonacci retracement level of its October-February upside, near 0.6030.

However, the monthly low and the 61.8% Fibonacci retracement, respectively near 0.5985 and 0.5900, could challenge the pair sellers afterward. It’s worth noting that the 0.6000 psychological magnet also acts as a downside filter.

Meanwhile, NZD/USD recovery remains elusive unless the quote crosses the 0.6140-45 resistance confluence comprising the 21-day EMA and the monthly support-turned-resistance line.

In a case where NZD/USD manages to cross the 0.6145 hurdle, the 200-day EMA and the monthly high, at 0.6220 and 0.6250 in that order, will be in the spotlight.

NZD/USD: Daily chart

Trend: Further downside expected

Additional important levels

Overview
Today last price0.6078
Today Daily Change0.0002
Today Daily Change %0.03%
Today daily open0.6076
 
Trends
Daily SMA200.6138
Daily SMA500.6169
Daily SMA1000.6199
Daily SMA2000.6159
 
Levels
Previous Daily High0.6173
Previous Daily Low0.6068
Previous Weekly High0.6237
Previous Weekly Low0.6116
Previous Monthly High0.6385
Previous Monthly Low0.5985
Daily Fibonacci 38.2%0.6108
Daily Fibonacci 61.8%0.6133
Daily Pivot Point S10.6038
Daily Pivot Point S20.6001
Daily Pivot Point S30.5933
Daily Pivot Point R10.6143
Daily Pivot Point R20.6211
Daily Pivot Point R30.6248

Author

Anil Panchal

Anil Panchal

FXStreet

Anil Panchal has nearly 15 years of experience in tracking financial markets. With a keen interest in macroeconomics, Anil aptly tracks global news/updates and stays well-informed about the global financial moves and their implications.

More from Anil Panchal
Share:

Markets move fast. We move first.

Orange Juice Newsletter brings you expert driven insights - not headlines. Every day on your inbox.

By subscribing you agree to our Terms and conditions.

Editor's Picks

EUR/USD flatlines below 1.1800 amid trading lull, awaits Fed Minutes

EUR/USD trades around a flatline below 1.1800 in European trading on Tuesday. The pair lacks any trading impetus as the US Dollar moves little amid market caution ahead of the Fed's December Meeting Minutes release, which could offer insights into the Federal Reserve’s 2026 outlook.

GBP/USD retakes 1.3500 despite the year-end grind

GBP/USD finds fresh demand and retakes 1.3500 on Tuesday as markets grind through the last trading week of the year. Despite the latest uptick, the pair is unlikely to see further progress due to the year-end holiday volumes.

Gold holds the bounce on Fed rate cut bets, safe-haven flows

Gold holds the rebound near $4,350 in the European trading hours on Tuesday. The precious metal recovers some lost ground after falling 4.5% in the previous session, which was Gold's largest single-day loss since October. Increased margin requirements on gold and silver futures by the Chicago Mercantile Exchange Group, one of the world’s largest trading floors for commodities, prompted widespread profit-taking and portfolio rebalancing.

Tron steadies as Justin Sun invests $18 million in Tron Inc.

Tron (TRX) trades above $0.2800 at press time on Monday, hovering below the 50-day Exponential Moving Average (EMA) at $0.2859.

Economic outlook 2026-2027 in advanced countries: Solidity test

After a year marked by global economic resilience and ending on a note of optimism, 2026 looks promising and could be a year of solid economic performance. In our baseline scenario, we expect most of the supportive factors at work in 2025 to continue to play a role in 2026.

Crypto market outlook for 2026

Year 2025 was volatile, as crypto often is.  Among positive catalysts were favourable regulatory changes in the U.S., rise of Digital Asset Treasuries (DAT), adoption of AI and tokenization of Real-World-Assets (RWA).