|

NZD/USD Price Analysis: Further downside past 0.6100 appears impulsive

  • NZD/USD remains pressured after reversing from one-week high, sidelined amid NZ holiday.
  • Failure to extend corrective bounce off seven-month low keeps Kiwi bears hopeful.
  • RSI, MACD conditions prod further downside but 10-DMA, previous support line restricts buyers from taking control.

NZD/USD fades bounce off the lowest levels in seven months, keeping the previous day’s retreat, as it holds lower grounds near 0.6060 amid early Monday morning in Asia. In doing so, the Kiwi pair portrays the quote’s inability to defend the previous week’s corrective bounce off the multi-day low amid failure to cross the key support-turned-resistance line and the 10-DMA.

Apart from the 10-DMA and the previous support line stretched from November 2022, respectively near 0.6060 and 0.6110, the absence of New Zealand (NZ) traders due to the holidays in Auckland also allow the Kiwi pair to continue extending the previous losses.

However, the nearly oversold RSI (14) line and the looming bull cross on the MACD allow the NZD/USD to pare previous losses in a case where the quote manages to stay firmer past the aforementioned key resistances, namely near 0.6060 and 0.6110.

In a case where the NZD/USD price remains firmer past 0.6110, the odds of witnessing a run-up towards the mid-May swing low, around 0.6185, can’t be ruled out.

Following that, the May 19 peak of around 0.6310 could entertain the Kiwi pair buyers before directing them to a four-month-old horizontal resistance area surrounding 0.6390.

On the contrary, pullback moves may initially aim for the 50% Fibonacci retracement level of its October 2022 to February 2023 upside, near 0.6025, before challenging the 0.6000 round figure.

It’s worth observing that the NZD/USD downside past the 0.6000 support needs to remain below the latest swing low of around 0.5985 to keep the bears on board.

NZD/USD: Daily chart

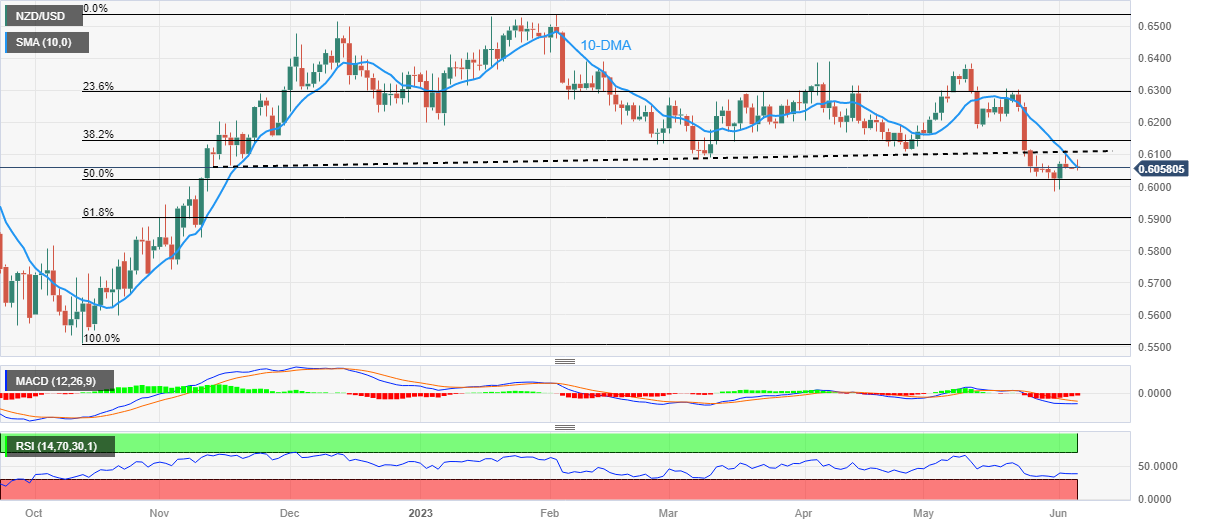
Trend: Further downside expected

Additional important levels

Overview
Today last price0.6057
Today Daily Change-0.0004
Today Daily Change %-0.07%
Today daily open0.6061
 
Trends
Daily SMA200.6181
Daily SMA500.6204
Daily SMA1000.625
Daily SMA2000.615
 
Levels
Previous Daily High0.6112
Previous Daily Low0.6055
Previous Weekly High0.6112
Previous Weekly Low0.5985
Previous Monthly High0.6385
Previous Monthly Low0.5985
Daily Fibonacci 38.2%0.6077
Daily Fibonacci 61.8%0.609
Daily Pivot Point S10.604
Daily Pivot Point S20.6019
Daily Pivot Point S30.5983
Daily Pivot Point R10.6097
Daily Pivot Point R20.6133
Daily Pivot Point R30.6154

Author

Anil Panchal

Anil Panchal

FXStreet

Anil Panchal has nearly 15 years of experience in tracking financial markets. With a keen interest in macroeconomics, Anil aptly tracks global news/updates and stays well-informed about the global financial moves and their implications.

More from Anil Panchal
Share:

Markets move fast. We move first.

Orange Juice Newsletter brings you expert driven insights - not headlines. Every day on your inbox.

By subscribing you agree to our Terms and conditions.

Editor's Picks

EUR/USD trades around 1.1700 after rebounding from 50-day EMA

EUR/USD gains ground after three days of losses, trading around 1.1700 during the Asian hours on Wednesday. On the daily chart, technical analysis indicates a potential for a bearish bias; the 14-day Relative Strength Index at 47 confirms waning momentum.

GBP/USD climbs above 1.3500 as US Dollar weakens ahead of ISM Services PMI

GBP/USD gains some ground after registering modest gains in the previous session, trading around 1.3510 during the Asian hours on Wednesday. The pair edges higher as the US Dollar struggles ahead of the US ISM Services Purchasing Managers’ Index and JOLTs job openings due later in the day.

Gold pulls back from $4,500 amid profit-taking ahead of key US macro data

Gold struggles to capitalize on its strong weekly gains registered over the past two days and faces rejection near the $4,500 psychological mark, or over a one-week high touched during the Asian session on Wednesday. As investors digest the recent US attack on Venezuela, the prevalent risk-on environment prompts some profit-taking around the commodity. 

Bitcoin, Ethereum and Ripple cool off as rally stalls near key resistance zones

Bitcoin, Ethereum, and Ripple prices are taking a breather on Wednesday near their key resistance levels following the recent surge. BTC faces rejection at the $94,253 level, while ETH and XRP follow BTC’s footsteps, struggling near $3,308 and $2.35, respectively.

Implications of US intervention in Venezuela

Events in Venezuela are top of mind for market participants, and while developments are associated with an elevated degree of uncertainty, we are not making any changes to our markets or economic forecasts as a result of the deposition of Nicolás Maduro. 

Aave Price Forecast: AAVE eyes bullish breakout as on-chain and derivatives data turns supportive

Aave (AAVE) price hovers around $172 on Wednesday, nearing the upper trendline of the falling parallel channel pattern. A break above this technical pattern favors the bulls.