|

NZD/USD Price Analysis: Finds acceptance above 200-EMA as USD Index incurs losses

  • NZD/USD has extended its revival move above 0.6230 as USD Index has extended losses.
  • The US Dollar has failed to capitalize on hawkish commentary from Fed Bostic.
  • The Kiwi asset has scaled above the mighty 200-period EMA, indicating that the broader trend is bullish now.

The NZD/USD pair has stretched its recovery above 0.6230 in the Asian session. A revival in the Kiwi asset is backed by a further correction in the US Dollar Index (DXY). The USD Index has extended its losses after surrendering the critical support of 105.00. The USD Index has dropped to near 104.80 and is expected to remain on the tenterhooks ahead of the release of the United States ISM Services PMI data.

S&P500 futures are showing marginal losses in the Asian session after a solid recovery on Thursday, portraying a minor caution amid overall bullish market sentiment. The return provided on 10-year US Treasury bonds is hovering above 4.06%.

The USD Index is struggling to stabilize its feet despite hawkish commentaries from Federal Reserve (Fed) policymakers. Atlanta Fed Bank President Raphael Bostic has favored a 25 basis points rate hike in March but has left room opened for a more hawkish rate outlook if inflation and labor market data come in stronger.

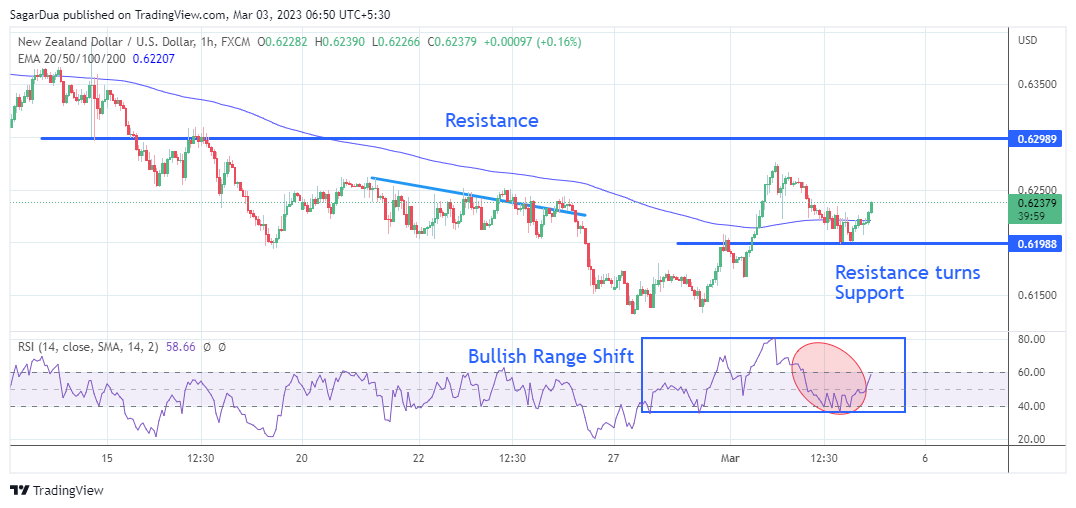
NZD/USD has witnessed stellar buying interest after dropping to near the horizontal support plotted from March 2 low at 0.6200, which was earlier a resistance for the New Zealand Dollar. The Kiwi asset has scaled above the mighty 200-period Exponential Moving Average (EMA) at 0.6220, indicating that the broader trend is bullish now.

A scrutiny of the Relative Strength Index (RSI) (14) indicates that the momentum oscillator has already delivered a bullish reversal. The oscillation range of the RSI (14) has already shifted to 40.00-80.00. Therefore, the momentum indicator has found a cushion at 40.00.

A buying opportunity in the Kiwi asset will emerge it will surpass March 1 high at 0.6276, which will drive the pair toward the round-level resistance at 0.6300 followed by February 14 high at 0.6389.

In an alternate scenario, a breakdown of January 6 low at 0.6193 will drag the asset toward November 28 low at 0.6155. A slippage below the latter will expose the asset for more downside toward the round-level support at 0.6100.

NZD/USD hourly chart

NZD/USD

Overview
Today last price0.6232
Today Daily Change0.0010
Today Daily Change %0.16
Today daily open0.6222
 
Trends
Daily SMA200.6264
Daily SMA500.6339
Daily SMA1000.6211
Daily SMA2000.6179
 
Levels
Previous Daily High0.627
Previous Daily Low0.6199
Previous Weekly High0.6263
Previous Weekly Low0.6151
Previous Monthly High0.6538
Previous Monthly Low0.6131
Daily Fibonacci 38.2%0.6226
Daily Fibonacci 61.8%0.6243
Daily Pivot Point S10.619
Daily Pivot Point S20.6159
Daily Pivot Point S30.6119
Daily Pivot Point R10.6261
Daily Pivot Point R20.6301
Daily Pivot Point R30.6333

Author

Sagar Dua

Sagar Dua

FXStreet

Sagar Dua is associated with the financial markets from his college days. Along with pursuing post-graduation in Commerce in 2014, he started his markets training with chart analysis.

More from Sagar Dua
Share:

Markets move fast. We move first.

Orange Juice Newsletter brings you expert driven insights - not headlines. Every day on your inbox.

By subscribing you agree to our Terms and conditions.

Editor's Picks

EUR/USD eases to near 1.1650, eyes US PCE for fresh impetus

EUR/USD turns south to test 1.1650 in European trading on Friday, facing rejection once again near seven-week highs. The pair, however, continues to draw support from persistent US Dollar selling bias, despite a cautious market mood. Traders now await the US September PCE inflation and UoM Consumer Sentiment data. 

GBP/USD holds gains near 1.3350 ahead of US data

GBP/USD sticks to a positive bias near 1.3350 in the European session on Friday. Traders prefer to wait on the sidelines ahead of the key US inflation and sentiment data due later in the day. In the meantime, broad-based US Dollar weakness helps the pair stay afloat. 

Gold remains below $4,250 barrier as traders await US PCE data for directional impetus

Gold gains some positive traction on Friday, though it remains confined in the weekly range. Dovish Fed expectations continue to undermine the USD and lend support to the commodity. Bulls, however, might opt to wait for the US PCE Price Index before placing aggressive bets.

Pi Network: Bearish streak nears critical support trendline

Pi Network edges lower on Friday for the third consecutive day, approaching a local support trendline. The on-chain data suggests an increase in supply pressure as Centralized Exchanges experience a surge in inflows. Technically, the pullback in PI risks further losses, as the Moving Average Convergence Divergence indicator is flashing a sell signal. 

Canada Unemployment Rate expected to edge higher in November ahead of BoC rate decision

Statistics Canada will release its Labour Force Survey on Friday, and markets are bracing for a weak print. The Unemployment Rate is expected to tick higher to 7% in November, while the Employment Change is forecast to come in flat after a nice gain in October.

Pi Network Price Forecast: Bearish streak nears critical support trendline

Pi Network (PI) edges lower on Friday for the third consecutive day, approaching a local support trendline. The on-chain data suggests an increase in supply pressure as Centralized Exchanges (CEXs) experience a surge in inflows.