|

NZD/USD Price Analysis: Fades bounce off 100-SMA below 0.6340 resistance

  • NZD/USD struggles to extend the previous day’s run-up below two-month-old resistance line.
  • RSI hints at limited upside room, two-week-old ascending trend line adds to the downside filters.
  • Multiple supports below 0.6200 signal bumpy road for bears.

NZD/USD bulls take a breather, after snapping a two-day downtrend, as the quote seesaws around the 0.6300 threshold during Friday’s Asian session.

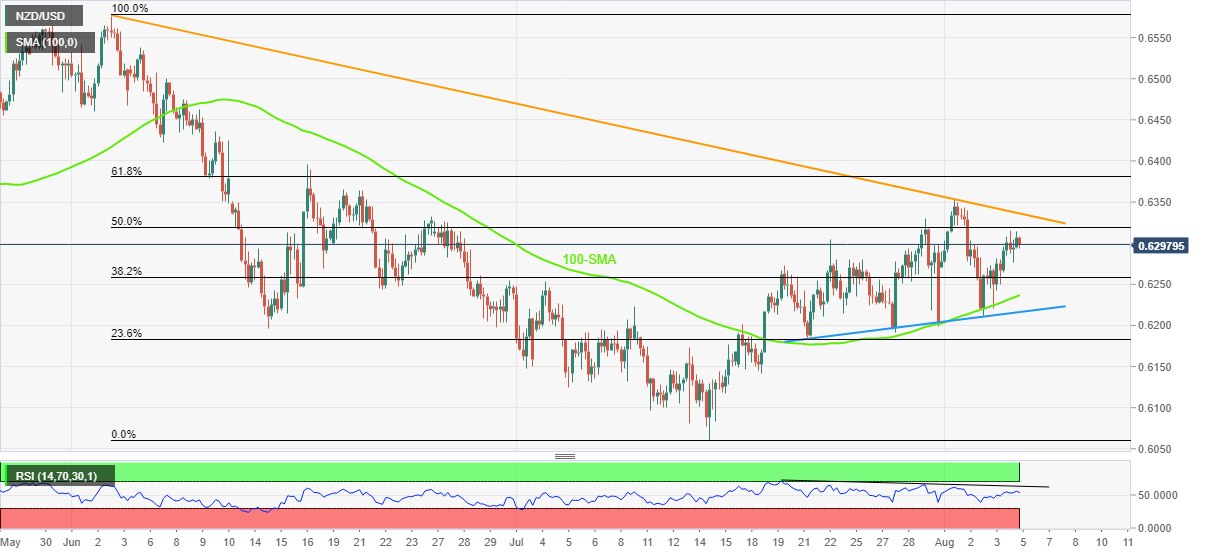
In doing so, the Kiwi pair fades bounce off 100-SMA and an 11-day-long support line. The pullback also takes place ahead of the resistance line stretched from June 2022.

It’s worth observing that the lower highs of the RSI (14) also invalidate the previous recovery and hence keeping NZD/USD sellers hopeful.

With this in mind, the intraday bears can aim for the 38.2% Fibonacci retracement of the June-July downside, near 0.6260.

However, the 100-SMA and the aforementioned support line, respectively around 0.6240 and 0.6215, could challenge the NZD/USD sellers afterward.

In a case where the quote drops below 0.6215, the 0.6200 and multiple supports beyond 0.6100 could challenge the further downside.

Alternatively, recovery moves may initially attack the 50% Fibonacci retracement level of 0.6320 before poking the downward sloping resistance line from June, close to 0.6335 by the press time.

In a case where the NZD/USD prices rally beyond 0.6335, the mid-June swing high near 0.6395 and the 0.6400 could lure the bulls.

NZD/USD: Four-hour chart

Trend: Pullback expected

Additional important levels

Overview
Today last price0.6301
Today Daily Change0.0043
Today Daily Change %0.69%
Today daily open0.6258
 
Trends
Daily SMA200.6215
Daily SMA500.6296
Daily SMA1000.6482
Daily SMA2000.6651
 
Levels
Previous Daily High0.6282
Previous Daily Low0.6212
Previous Weekly High0.633
Previous Weekly Low0.6192
Previous Monthly High0.633
Previous Monthly Low0.6061
Daily Fibonacci 38.2%0.6239
Daily Fibonacci 61.8%0.6255
Daily Pivot Point S10.6219
Daily Pivot Point S20.6181
Daily Pivot Point S30.6149
Daily Pivot Point R10.6289
Daily Pivot Point R20.6321
Daily Pivot Point R30.6359

Author

Anil Panchal

Anil Panchal

FXStreet

Anil Panchal has nearly 15 years of experience in tracking financial markets. With a keen interest in macroeconomics, Anil aptly tracks global news/updates and stays well-informed about the global financial moves and their implications.

More from Anil Panchal
Share:

Editor's Picks

EUR/USD looks to regain the 200-day SMA

EUR/USD regains some balance and trade just above 1.1600 the figure ahead of the opening bell in Asia. The pair initially dipped to the 1.1530 zone for the first time since November, always following the stronger US Dollar and the marked flight-to-safety in the context of the ongoing Middle East crisis
 

GBP/USD attacks 1.3300, refreshing three-month lows

GBP/USD is deep in the red near 1.3300, accelerating its downside to renew three-month lows in European trading on Tuesday. The ongoing escalation in the Iran war, combined with rising Oil prices, weighs negatively on the higher-yielding Pound Sterling as the US Dollar capitalizes on increased haven demand.

Gold bounces off lows, back above $5,100

Gold remains on the defensive, eroding part of the recent multi-day advance and managing to trade back above the $5,100 mark per troy ounce on Tuesday. The precious metal initially dropped just below the critical $5,000 threshold on the back of the persistent strength of the Greenback, higher US Treasury yields across the curve and investors' repricing of Fed rate cuts.

XRP risks extending losses as US-Iran war rages on

Ripple (XRP) has come under pressure, drifting lower to $1.35 at the time of writing on Tuesday. The over 2% correction looks poised to erase the previous day’s gains, which lifted the remittance token to $1.42.

Energy shock 2.0: Why rising Gas prices could hit the Euro

Even without a confirmed, sustained disruption, the mere risk to a key global energy chokepoint is enough to inject a significant premium into European Gas markets. And for the Euro, that matters.

Ripple falters amid sell-off jitters and negative funding rates

Ripple (XRP) has come under pressure, drifting lower to $1.35 at the time of writing on Tuesday. The over 2% correction looks poised to erase the previous day’s gains, which lifted the remittance token to $1.42.