NZD/USD Price Analysis: Drops back to revisit support confluence around 0.7220
- NZD/USD snaps three-day winning streak to retest 50-day SMA, 12-week-old previous support.
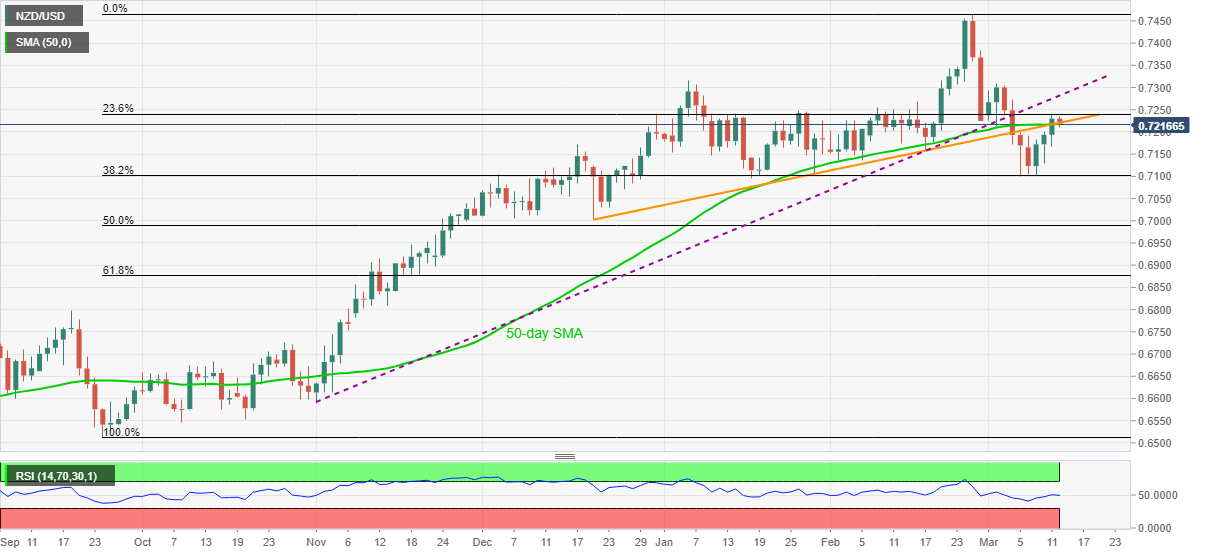
- Normal RSI, recovery from 38.2% Fibonacci retracement favor bulls.

NZD/USD alternates gains with losses, drops 0.18% to 0.7217, during early Friday. The kiwi pair initially rose towards the weekly top before taking a U-turn from 0.7234. In doing so, the quote wavers around the previous support line from late December 2020 and 50-day SMA.
However, the absence of extreme RSI conditions and the pair’s sustained recovery moves from 38.2% Fibonacci retracement of September 2020 to February 2021 upside, around 0.7100, keeps the NZD/USD buyers hopeful.
As a result, the prices are likely to aim for an ascending trend line from early November 2020, at 0.7280 now, during the fresh run-up.
If at all the NZD/USD bulls keep the reins past-0.7280, the monthly peak and January tops near 0.7310-15 will be the key hurdle to watch.
On the downside, a daily closing below 38.2% Fibonacci retracement level of 0.7100 will eye the December 2020 low near the 0.7000 threshold but further declines may find it tough to break the key Fibonacci retracement levels around 0.6990 and 0.6875.
Overall, NZD/USD remains in the uptrend but intermediate pullbacks can’t be ruled out.
NZD/USD daily chart
Trend: Bullish
Author

Anil Panchal
FXStreet
Anil Panchal has nearly 15 years of experience in tracking financial markets. With a keen interest in macroeconomics, Anil aptly tracks global news/updates and stays well-informed about the global financial moves and their implications.


