Shiba Inu Price Forecast: SHIB bears tighten grip, aiming for yearly lows
- Shiba Inu price extends correction on Wednesday, printing fifth consecutive red candlesticks.
- Bearish sentiment deepens as social dominance declines, short positions rise, and open interest falls.
- The technical outlook suggests further downside, targeting the yearly low of $0.0000067.

Shiba Inu (SHIB) price remains under pressure, trading below $0.000070 on Wednesday as bearish momentum continues to dominate the broader crypto market. On-chain and derivatives data further support the bearish sentiment, while technical analysis suggests a deeper correction targeting the yearly lows.
SHIB on-chain and derivatives data show bearish bias
Santiment’s Social Dominance metric for Shiba Inu supports a bearish outlook. The index measures the share of SHIB-related discussions across the cryptocurrency media. It has consistently declined since mid-November, reaching 0.032% on Wednesday, near its annual lows. This fall indicates fading market interest and weakening sentiment among SHIB investors.
 [12-1766562496374-1766562496375.19.17, 24 Dec, 2025].png)
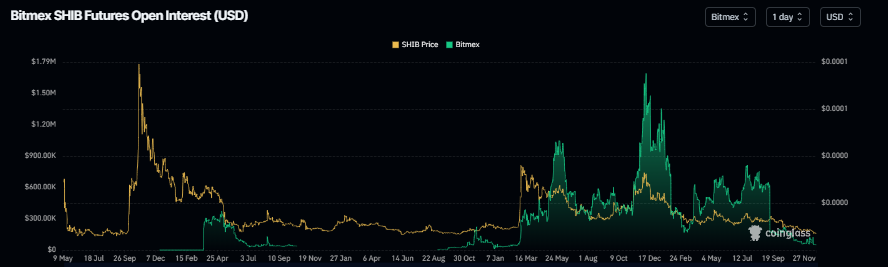
On the derivatives data, Shiba Inu’s futures Open Interest (OI) on Bitmex exchange dropped to $50,140 on Wednesday, its new yearly low, according to Coinglass data. This drop in OI reflects waning investor participation and projects a bearish outlook.
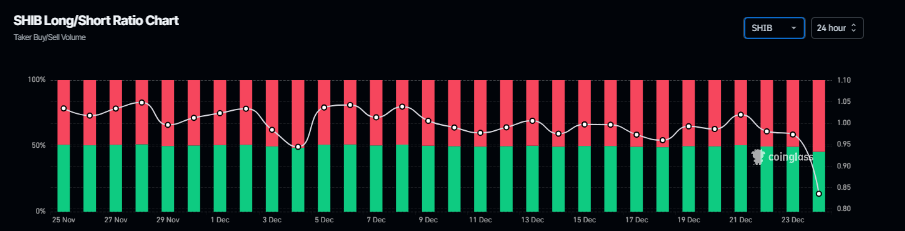
In addition, Coinglass’s long-to-short ratio for SHIB reads 0.83 on Wednesday, the highest level over a month. The ratio below one suggests bearish sentiment in the market, as more traders are betting on the memecoin price to fall.
Shiba Inu Price Forecast: SHIB bears aiming for yearly lows
Shiba Inu price was rejected from the upper trendline of the falling wedge pattern on December 10 and declined more than 14% in two weeks. As of Wednesday, SHIB is trading at $0.0000070.
If SHIB continues its correction, it could extend the decline toward the yearly low of $0.0000067 set on October 10.
The Relative Strength Index (RSI) on the daily chart is 32, nearing the oversold region, indicating strong bearish momentum. Additionally, the Moving Average Convergence Divergence (MACD)showed a bearish crossover last week, further supporting the bearish outlook.
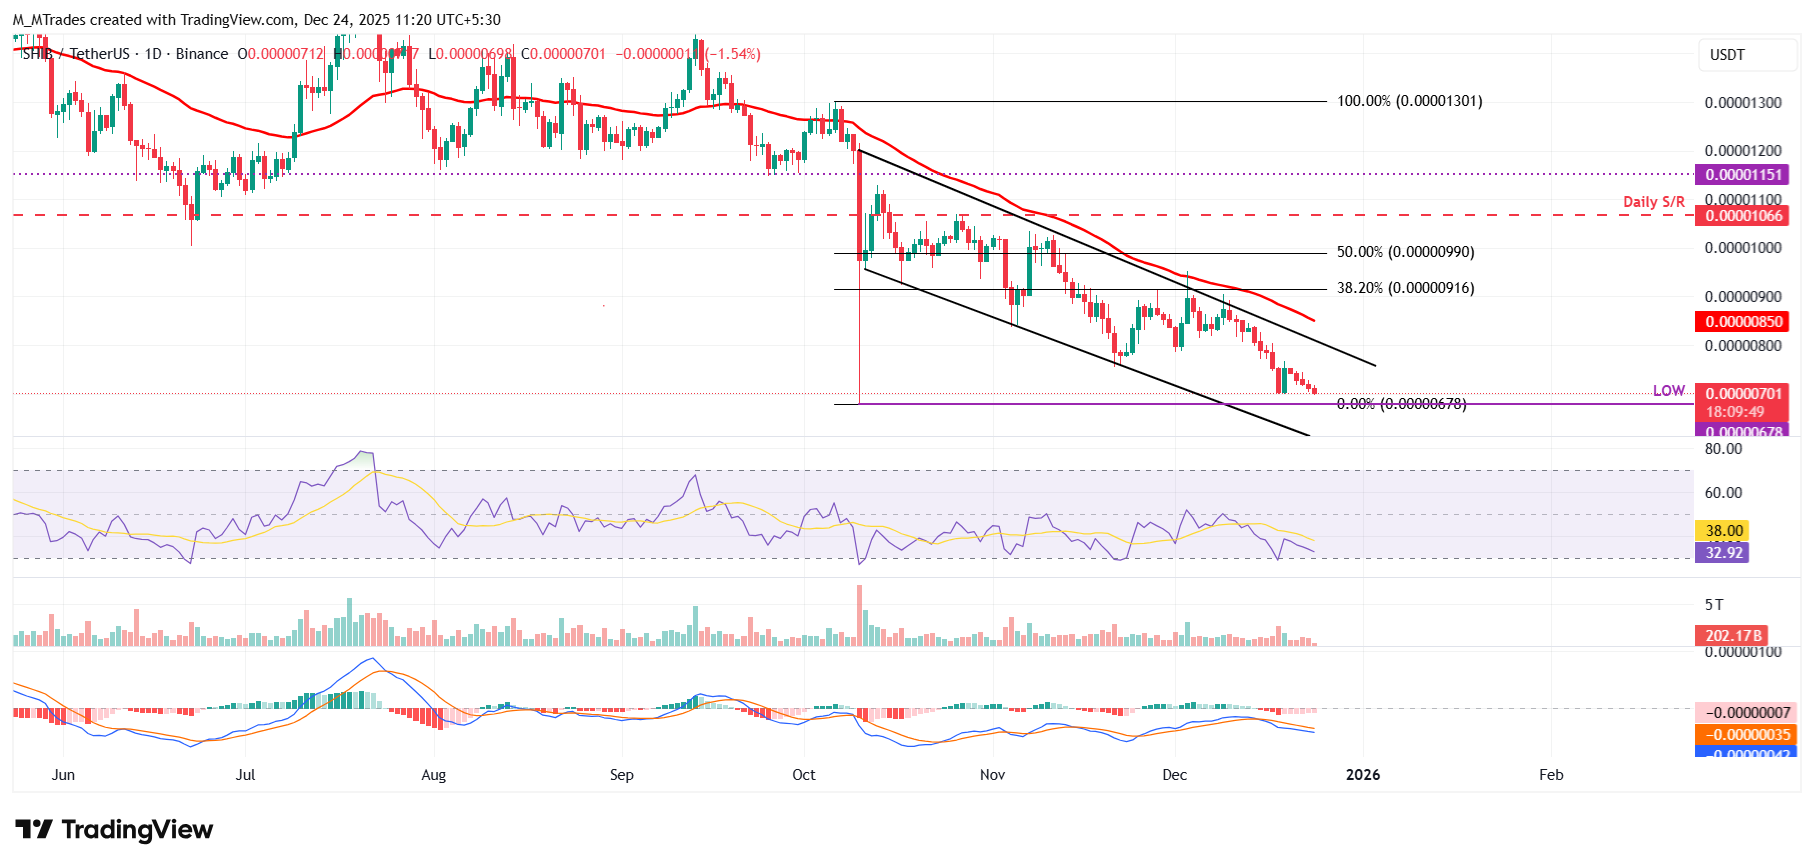
On the other hand, if SHIB recovers, it could extend the advance toward the 50-day Exponential Moving Average (EMA) at $0.0000085.
Author

Manish Chhetri
FXStreet
Manish Chhetri is a crypto specialist with over four years of experience in the cryptocurrency industry.



