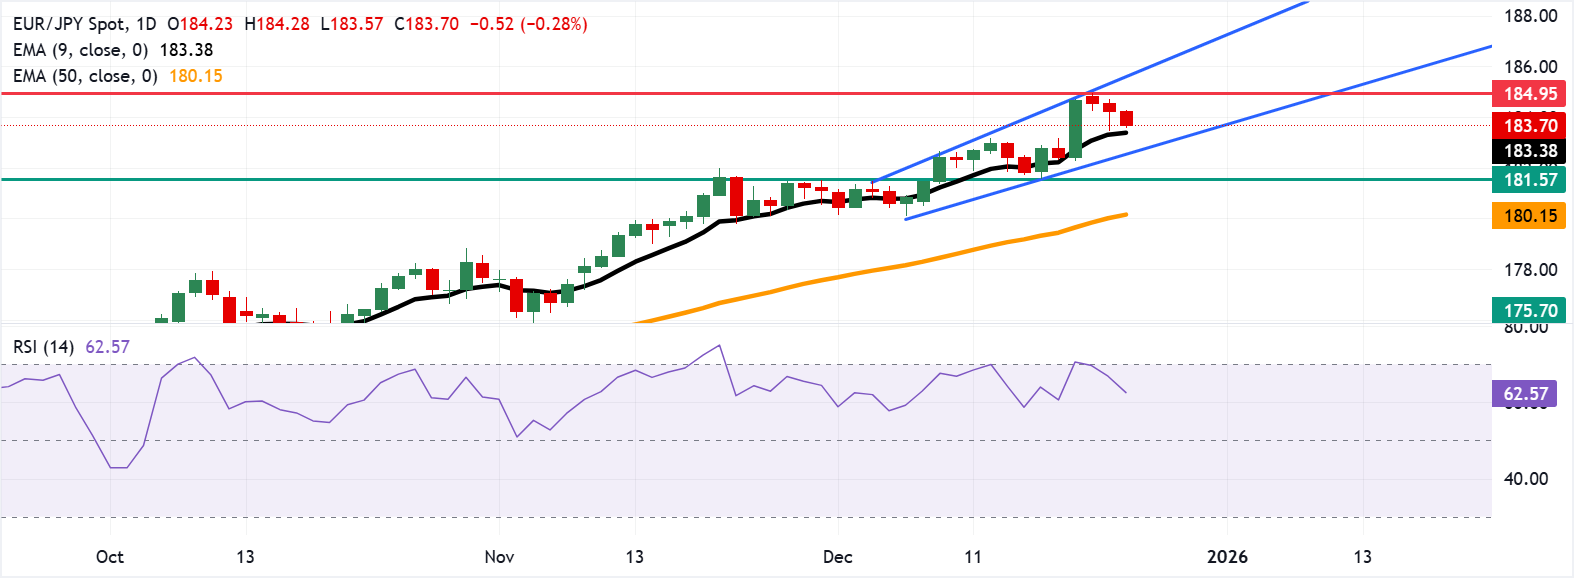
EUR/JPY Price Forecast: Falls to near 183.50, nine-day EMA
- EUR/JPY may rebound toward the all-time high of 184.95.
- The 14-day Relative Strength Index stands at 62.20, supporting positive momentum.
- The immediate support is seen at the nine-day EMA of 183.37.

EUR/JPY extends its losses for the third successive session, trading around 183.70 during the European hours on Wednesday. The currency cross remains within the ascending channel pattern, suggesting a persistent bullish bias. Additionally, the 14-day Relative Strength Index (RSI) sits at 62.20, easing from overbought yet still supportive of positive momentum.
The EUR/JPY cross holds above the nine-day Exponential Moving Average (EMA) and the 50-day EMA, with both averages rising and confirming a bullish structure. The short-term average remains above the medium-term gauge, keeping the upside bias in place. The broader tone favors dip-buying while price holds over the rising 50-day EMA.
The EUR/JPY cross may rebound toward the all-time high of 184.95, which was recorded on December 22, aligned with the psychological level of 185.00. Further advances would support the currency cross to test the upper boundary of the ascending channel around 185.70.
The immediate support lies at the nine-day EMA of 183.37, followed by the lower ascending channel boundary. A break below the channel would weaken the bullish bias and put downward pressure on the pair to test the two-week low of 181.57, recorded on December 17. Further declines would open the doors for the currency cross to explore the region around the 50-day EMA at 180.15.
Euro Price Today
The table below shows the percentage change of Euro (EUR) against listed major currencies today. Euro was the weakest against the Japanese Yen.
| USD | EUR | GBP | JPY | CAD | AUD | NZD | CHF | |
|---|---|---|---|---|---|---|---|---|
| USD | -0.08% | -0.17% | -0.36% | -0.11% | -0.17% | -0.12% | -0.16% | |
| EUR | 0.08% | -0.09% | -0.29% | -0.04% | -0.09% | -0.04% | -0.08% | |
| GBP | 0.17% | 0.09% | -0.21% | 0.04% | -0.00% | 0.05% | 0.00% | |
| JPY | 0.36% | 0.29% | 0.21% | 0.26% | 0.19% | 0.24% | 0.21% | |
| CAD | 0.11% | 0.04% | -0.04% | -0.26% | -0.07% | -0.02% | -0.04% | |
| AUD | 0.17% | 0.09% | 0.00% | -0.19% | 0.07% | 0.05% | -0.02% | |
| NZD | 0.12% | 0.04% | -0.05% | -0.24% | 0.02% | -0.05% | -0.04% | |
| CHF | 0.16% | 0.08% | -0.01% | -0.21% | 0.04% | 0.02% | 0.04% |
The heat map shows percentage changes of major currencies against each other. The base currency is picked from the left column, while the quote currency is picked from the top row. For example, if you pick the Euro from the left column and move along the horizontal line to the US Dollar, the percentage change displayed in the box will represent EUR (base)/USD (quote).
(The technical analysis of this story was written with the help of an AI tool.)
Author

Akhtar Faruqui
FXStreet
Akhtar Faruqui is a Forex Analyst based in New Delhi, India. With a keen eye for market trends and a passion for dissecting complex financial dynamics, he is dedicated to delivering accurate and insightful Forex news and analysis.


