|

NZD/USD Price Analysis: Bulls stay on the way to 200-DMA around 0.6900

  • NZD/USD grinds higher at weekly top, up for the fourth consecutive day.
  • Monthly peak, 61.8% Fibonacci retracement add to the upside filters.
  • Pullback remains elusive beyond 50-DMA, MACD favors buyers.

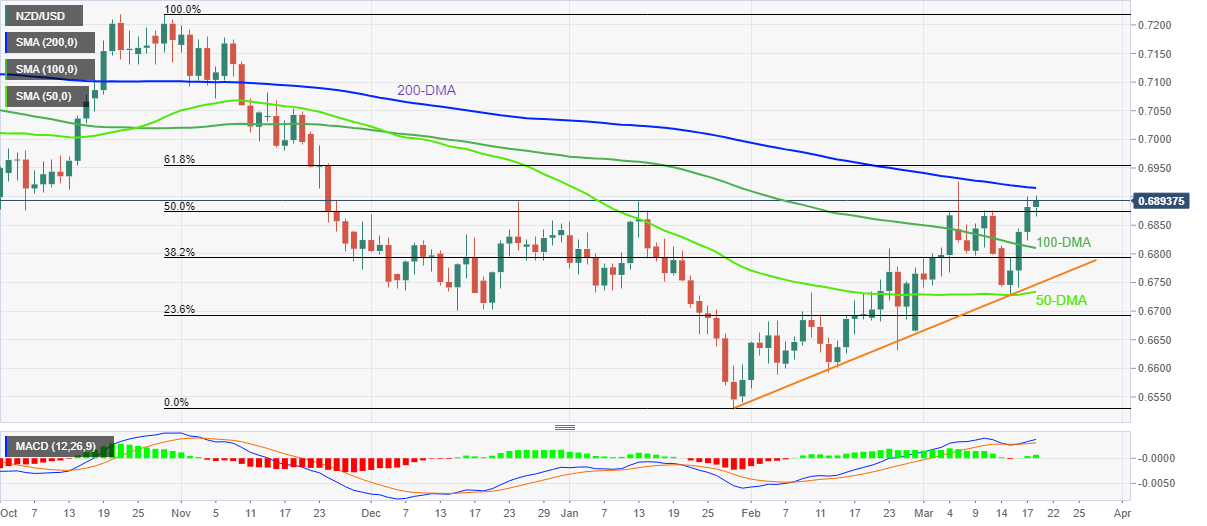
NZD/USD remains on the front foot around 0.6900 while printing a four-day winning streak during Friday’s Asian session.

In doing so, the Kiwi pair justifies the early-week bounce off the 50-DMA, as well as the following run-up beyond the 100-DMA, amid bullish MACD signals.

However, the 200-DMA level of 0.6915 challenges the NZD/USD bulls of late.

Also acting as the key upside hurdle is the monthly peak and 61.8% Fibonacci retracement (Fibo.) of October 2021 to January 2022 downside, respectively around 0.6930 and 0.6955.

Meanwhile, pullback moves may aim for the 50% Fibo. surrounding 0.6870 before dropping back to the 100-DMA level of 0.6810.

It should be noted, however, that an upward sloping trend line from late January and the 50-DMA, respectively around 0.6750 and 0.6730, will challenge the NZD/USD bears afterward.

In a case where the quote drops below 0.6730, it becomes vulnerable to test 2022 low near 0.6530.

NZD/USD: Daily chart

Trend: Further upside expected

Additional important levels

Overview
Today last price0.6893
Today Daily Change0.0011
Today Daily Change %0.16%
Today daily open0.6882
 
Trends
Daily SMA200.6786
Daily SMA500.6731
Daily SMA1000.6813
Daily SMA2000.6916
 
Levels
Previous Daily High0.69
Previous Daily Low0.6823
Previous Weekly High0.6926
Previous Weekly Low0.6796
Previous Monthly High0.681
Previous Monthly Low0.6565
Daily Fibonacci 38.2%0.6871
Daily Fibonacci 61.8%0.6852
Daily Pivot Point S10.6837
Daily Pivot Point S20.6791
Daily Pivot Point S30.676
Daily Pivot Point R10.6914
Daily Pivot Point R20.6945
Daily Pivot Point R30.6991

Author

Anil Panchal

Anil Panchal

FXStreet

Anil Panchal has nearly 15 years of experience in tracking financial markets. With a keen interest in macroeconomics, Anil aptly tracks global news/updates and stays well-informed about the global financial moves and their implications.

More from Anil Panchal
Share:

Editor's Picks

EUR/USD falls to near 1.1600 due to persistent bearish bias

EUR/USD depreciates after registering modest gains in the previous session, trading around 1.1610 during the Asian hours on Thursday. The technical analysis of the daily chart suggests a persistent bearish bias as the EUR/USD pair remains within the descending channel pattern.

GBP/USD underperforms as UK faces stagflation risks amid Middle East war

The Pound Sterling trades lower against its major currency peers, is down 0.22% around 1.3340 against the US Dollar, during the Asian trade on Thursday. The British currency faces selling pressures amid fears that the United Kingdom economy could face stagflation risks due to higher energy prices, a situation in which inflation accelerates with economic growth and employment conditions remaining stagnant.

Gold climbs near $5,200 as Iran war fuels safe-haven demand

Gold price extends its gains for the second successive session on Thursday as traders seek safety amid the ongoing war in the Middle East. US and Israeli strikes across Iranian territory and widespread Iranian missile and drone retaliation across the Middle East, including attacks on regional targets and military sites, prolong the crisis and its impact.

Top Crypto Gainers: Decred, Zcash, and Dogecoin lead recovery as Bitcoin crosses $72,000

Bitcoin trades above $72,500 at press time on Thursday, holding its 6% gain from the previous day, contributing to a broader market recovery. The total cryptocurrency market capitalization stands at over $2.43 trillion as the broader market sentiment improves significantly.

First Venezuela, now Iran: The US-China energy war escalates

At first glance, the latest escalation involving the United States with both Iran and Venezuela looks like another chapter in a long-running geopolitical story. But viewed through a broader strategic lens, something else may be unfolding: Energy.

Cardano Price Analysis: Approaches key trendline amid bearish sentiment

Cardano (ADA) price is approaching its descending trendline around $0.28 at the time of writing, set to shape the next directional move. The derivatives metrics paint a bearish picture, with ADA’s Open Interest continuing to fall and short bets rising among traders.