|

NZD/USD Price Analysis: 200-SMA checks Kiwi buyers within weekly bullish channel, Fed in focus

  • NZD/USD retreats from three-week high, stays mildly bid despite the latest fall toward intraday low.
  • Bullish chart formation, sustained trading beyond 100-SMA and downbeat US inflation keeps Kiwi pair buyers hopeful.
  • Sellers need validation from 0.6025 and the Fed to retake control.

NZD/USD pares intraday gains, the fifth in a row, as bulls catch a breather at the highest level in three weeks heading into Wednesday’s European session. In doing so, the Kiwi pare reverses from the 200-SMA as market positions for the US Federal Reserve (Fed) Interest Rate Decision amid escalating hopes of no rate hike after witnessing 10 consecutive lifts in the Fed rates. With this, the quote stays depressed near 0.6155 despite posting mild gains at the latest.

Also read: NZD/USD bulls step in ahead of the Fed

In addition to the failure to cross the 200-bar Simple Moving Average (SMA), the NZD/USD pair’s pullback also takes clues from the overbought RSI (14) line. However, a one-week-old ascending trend channel keeps the Kiwi pair buyers hopeful.

Hence, the quote’s latest weakness can challenge the short-term bullish chart formation by poking the 0.6130 support with eyes on the 100-SMA support surrounding 0.6085.

It’s worth mentioning that multiple levels marked since late May highlights 0.6030-25 as the last defense of the NZD/USD buyers.

On the contrary, the aforementioned 200-SMA restricts immediate upside of the NZD/USD pair near 0.6175.

Following that, the 61.8% Fibonacci retracement level of the pair’s May 19-31 downside, near 0.6185, will precede the previously stated channel’s top line, near 0.6205, to challenge the bulls.

NZD/USD: Four-hour chart
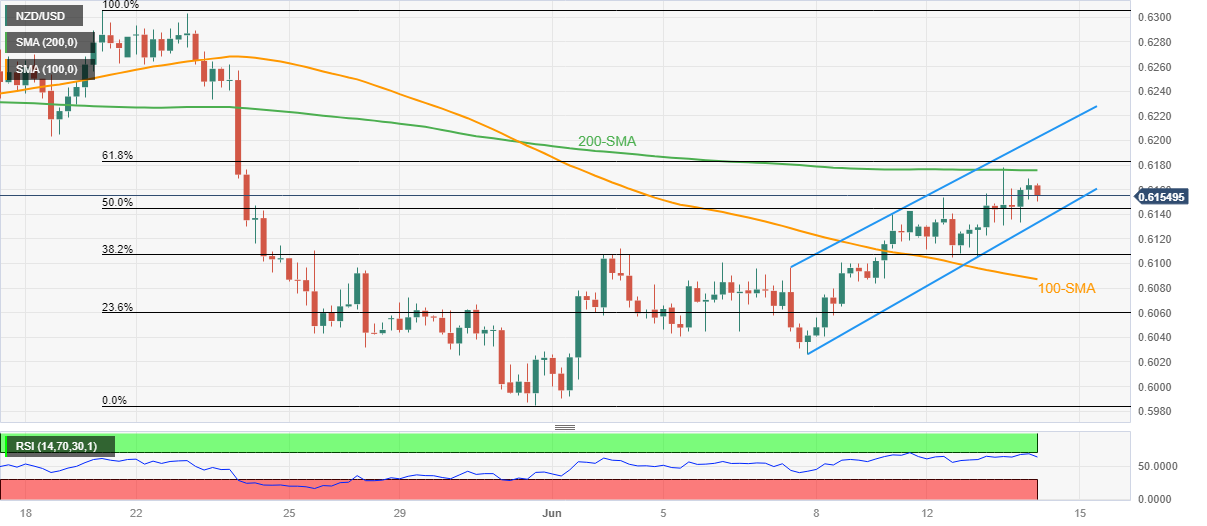
Trend: Bullish

Additional important levels

Overview
Today last price0.6152
Today Daily Change0.0003
Today Daily Change %0.05%
Today daily open0.6149
 
Trends
Daily SMA200.6115
Daily SMA500.6182
Daily SMA1000.6226
Daily SMA2000.615
 
Levels
Previous Daily High0.6178
Previous Daily Low0.6106
Previous Weekly High0.6143
Previous Weekly Low0.6026
Previous Monthly High0.6385
Previous Monthly Low0.5985
Daily Fibonacci 38.2%0.615
Daily Fibonacci 61.8%0.6134
Daily Pivot Point S10.6111
Daily Pivot Point S20.6072
Daily Pivot Point S30.6039
Daily Pivot Point R10.6183
Daily Pivot Point R20.6216
Daily Pivot Point R30.6255

Author

Anil Panchal

Anil Panchal

FXStreet

Anil Panchal has nearly 15 years of experience in tracking financial markets. With a keen interest in macroeconomics, Anil aptly tracks global news/updates and stays well-informed about the global financial moves and their implications.

More from Anil Panchal
Share:

Markets move fast. We move first.

Orange Juice Newsletter brings you expert driven insights - not headlines. Every day on your inbox.

By subscribing you agree to our Terms and conditions.

Editor's Picks

EUR/USD eyes 1.1800 barrier near two-month highs

EUR/USD extends its gains for the second successive session, trading around 1.1780 during the Asian hours on Tuesday. On the daily chart, technical analysis indicates a persistent bullish bias, as the pair moves upward within the ascending channel pattern. Additionally, the 14-day Relative Strength Index at 68.89 sits near overbought, signaling strong demand. RSI remains elevated, which could cap gains if overbought conditions emerge.

GBP/USD knocks ten-week highs ahead of holiday slowdown

GBP/USD found room on the high side on Monday, kicking off a holiday-shortened trading week with a fresh spat of Greenback weakness, bolstering the Pound Sterling into its highest bids in ten weeks. Pound traders are largely brushing off the latest interest rate cut from the Bank of England as the UK’s central bank policy strategy leaves the water murky for rate-cut watchers.

Gold bulls seem unstoppable amid supportive fundamental backdrop

Gold is seen building on the previous day's strong rally of over 2% and continues scaling new all-time highs for the second consecutive day on Tuesday. The commodity climbs closer to the $4,500 psychological mark during the Asian session and remains well supported by a combination of factors. 

Uniswap holds above $6 as traders eye UNIfication vote outcome

Uniswap price holds above $6 at the time of writing on Tuesday after closing above a key resistance zone in the previous week. Traders are focusing on the highly anticipated UNIfication proposal, which is set to conclude on Thursday, and could become a key near-term catalyst. On the technical side, momentum indicators are flashing bullish signals, hinting at an upside rally.

Ten questions that matter going into 2026

2026 may be less about a neat “base case” and more about a regime shift—the market can reprice what matters most (growth, inflation, fiscal, geopolitics, concentration). The biggest trap is false comfort: the same trades can look defensive… right up until they become crowded.

XRP steadies above $1.90 support as fund inflows and retail demand rise

Ripple (XRP) is stable above support at $1.90 at the time of writing on Monday, after several attempts to break above the $2.00 hurdle failed to materialize last week. Meanwhile, institutional interest in the cross-border remittance token has remained steady.