|

NZD/USD Price Analysis: 100-EMA prods bears eyeing 0.6130

  • NZD/USD holds lower ground near intraday low, snaps two-day winning streak.
  • RSI retreat backs the Kiwi pair’s U-turn from 200-EMA, one-month-long resistance line.
  • Receding bullish bias of MACD signals, failure to cross key upside hurdles keep sellers hopeful.
  • Fortnight-old horizontal support area lures bears past 100-EMA break.

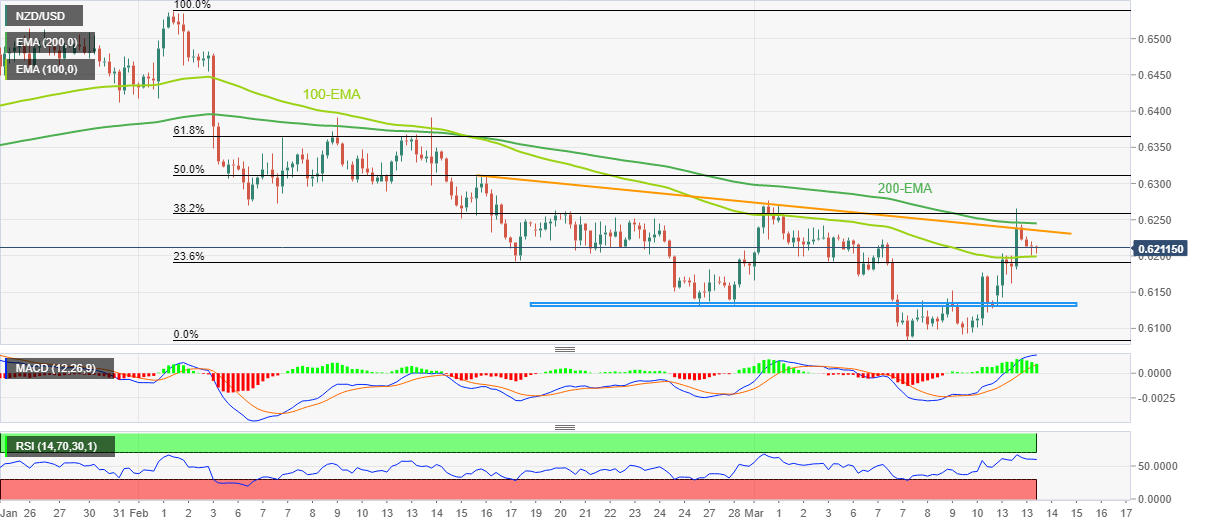
NZD/USD sticks to mild losses near 0.6210 during the first downbeat day in three heading into Tuesday’s European session. In doing so, the Kiwi pair struggles to break the 100-bar Exponential Moving Average (EMA) amid sluggish trading hours.

That said, the quote rose the most in nine weeks the previous day before retreating from 0.6265. The pullback moves could be linked to the NZD/USD pair’s inability to cross the 200-bar EMA, as well as a downward-sloping resistance line from mid-February.

Adding strength to the pullback moves could be the RSI (14) retreat from the overbought territory, as well as the receding bullish bias of the MACD signals.

It’s worth noting, however, that a clear downside break of the 100-bar EMA, around 0.6200 by the press time, becomes necessary for the NZD/USD bears to take control.

Following that, a south-run towards the two-week-old horizontal support zone near 0.6130 and then to the monthly low of 0.6084 can’t be ruled out.

On the contrary, the aforementioned trend line and 200-EMA restrict short-term NZD/USD recovery to around 0.6230 and 0.6245 in that order.

In a case where NZD/USD remains firmer past 0.6245, the odds of witnessing a rally targeting the mid-February high of 0.6390 can’t be ruled out.

NZD/USD: Four-hour chart

Trend: Further downside expected

Additional important levels

Overview
Today last price0.621
Today Daily Change-0.0010
Today Daily Change %-0.16%
Today daily open0.622
 
Trends
Daily SMA200.6206
Daily SMA500.6317
Daily SMA1000.6245
Daily SMA2000.6167
 
Levels
Previous Daily High0.6265
Previous Daily Low0.6131
Previous Weekly High0.6226
Previous Weekly Low0.6084
Previous Monthly High0.6538
Previous Monthly Low0.6131
Daily Fibonacci 38.2%0.6214
Daily Fibonacci 61.8%0.6182
Daily Pivot Point S10.6145
Daily Pivot Point S20.6071
Daily Pivot Point S30.6011
Daily Pivot Point R10.628
Daily Pivot Point R20.6339
Daily Pivot Point R30.6414

Author

Anil Panchal

Anil Panchal

FXStreet

Anil Panchal has nearly 15 years of experience in tracking financial markets. With a keen interest in macroeconomics, Anil aptly tracks global news/updates and stays well-informed about the global financial moves and their implications.

More from Anil Panchal
Share:

Markets move fast. We move first.

Orange Juice Newsletter brings you expert driven insights - not headlines. Every day on your inbox.

By subscribing you agree to our Terms and conditions.

Editor's Picks

EUR/USD moves sideways below 1.1800 on Christmas Eve

EUR/USD struggles to find direction and trades in a narrow channel below 1.1800 after posting gains for two consecutive days. Bond and stock markets in the US will open at the usual time and close early on Christmas Eve, allowing the trading action to remain subdued. 

GBP/USD keeps range around 1.3500 amid quiet markets

GBP/USD keeps its range trade intact at around 1.3500 on Wednesday. The Pound Sterling holds the upper hand over the US Dollar amid pre-Christmas light trading as traders move to the sidelines heading into the holiday season. 

Gold retreats from record highs, trades below $4,500

Gold retreats after setting a new record-high above $4,520 earlier in the day and trades in a tight range below $4,500 as trading volumes thin out ahead of the Christmas break. The US Dollar selling bias remains unabated on the back of dovish Fed expectations, which continues to act as a tailwind for the bullion amid persistent geopolitical risks.

Bitcoin slips below $87,000 as ETF outflows intensify, whale participation declines

Bitcoin price continues to trade around $86,770 on Wednesday, after failing to break above the $90,000 resistance. US-listed spot ETFs record an outflow of $188.64 million on Tuesday, marking the fourth consecutive day of withdrawals.

Economic outlook 2026-2027 in advanced countries: Solidity test

After a year marked by global economic resilience and ending on a note of optimism, 2026 looks promising and could be a year of solid economic performance. In our baseline scenario, we expect most of the supportive factors at work in 2025 to continue to play a role in 2026.

Avalanche struggles near $12 as Grayscale files updated form for ETF

Avalanche trades close to $12 by press time on Wednesday, extending the nearly 2% drop from the previous day. Grayscale filed an updated form to convert its Avalanche-focused Trust into an ETF with the US Securities and Exchange Commission.