• On Wednesday, the NZD/JPY clings to its gains, up some 0.10%, amid a risk-off environment.
  • A risk-off market mood triggered an equities sell-off in the US stock market, influencing risk-sensitive FX currencies, like the NZD.
  • The NZD/JPY is downward biased though a break above 77.00 would expose crucial DMAs.

The NZD/JPY edges up in the session, after Wall Street closed, gains some 0.22% after the Federal Reserve unveiled its monetary policy statement. At the time of writing, the NZD/JPY is trading at 76.20.

In the meantime, the risk sentiment got a toll after Fed’s Chairman Jerome Powell press conference, as shown by the NZD/JPY hourly chart, which depicts the pair slumped 60-pips.

However, in the aftermath of the press conference, the cross-currency pair trimmed some of its losses, trading at 76.20

NZD/JPY Price Forecast: Technical outlook

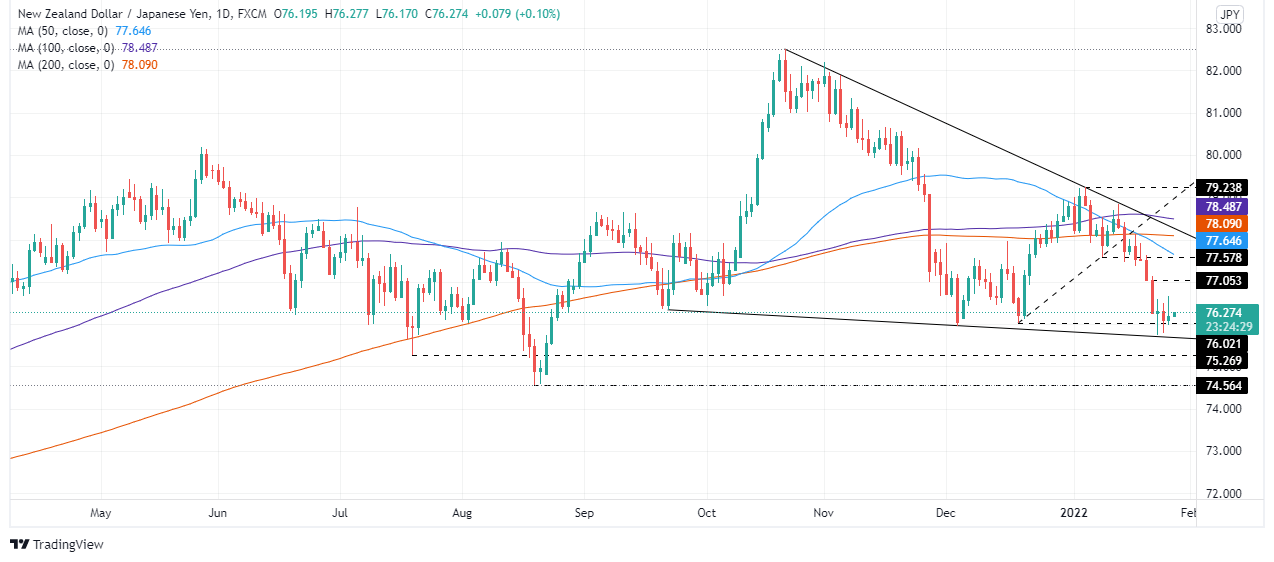
The NZD/JPY is downward biased per the daily chart. Nevertheless, JPY bulls have been unable to print a daily close below December 3, 2021, daily low at 75.96. The 50-day moving average (DMA) resides at 77.64, some 40-pips below the 200-DMA at 78.09, which is trapped between the former and the 100-DMA at 78.48.

That said, the NZD/JPY first support would be 76.00. A breach of the latter would expose the January 24 swing low at 75,74. If that level is broken, the next stop for the cross-currency would be July 20, 2021, pivot low at 75.27, and then August 19, 2021, low at 74.56.

Contrarily, the NZD/JPY first resistance would be January 26 daily high at 76.66. A daily close above that level would send the pair rallying towards January 21 daily high at 77.05, and then the 50-DMA at 77.64.

NZD/JPY

Overview
Today last price 76.26
Today Daily Change 0.08
Today Daily Change % 0.11
Today daily open 76.18
 
Trends
Daily SMA20 77.91
Daily SMA50 77.84
Daily SMA100 78.57
Daily SMA200 78.15
 
Levels
Previous Daily High 76.49
Previous Daily Low 75.8
Previous Weekly High 78.13
Previous Weekly Low 76.24
Previous Monthly High 78.94
Previous Monthly Low 75.97
Daily Fibonacci 38.2% 76.06
Daily Fibonacci 61.8% 76.22
Daily Pivot Point S1 75.82
Daily Pivot Point S2 75.46
Daily Pivot Point S3 75.12
Daily Pivot Point R1 76.51
Daily Pivot Point R2 76.85
Daily Pivot Point R3 77.21


Share: Feed news

Information on these pages contains forward-looking statements that involve risks and uncertainties. Markets and instruments profiled on this page are for informational purposes only and should not in any way come across as a recommendation to buy or sell in these assets. You should do your own thorough research before making any investment decisions. FXStreet does not in any way guarantee that this information is free from mistakes, errors, or material misstatements. It also does not guarantee that this information is of a timely nature. Investing in Open Markets involves a great deal of risk, including the loss of all or a portion of your investment, as well as emotional distress. All risks, losses and costs associated with investing, including total loss of principal, are your responsibility. The views and opinions expressed in this article are those of the authors and do not necessarily reflect the official policy or position of FXStreet nor its advertisers. The author will not be held responsible for information that is found at the end of links posted on this page.

If not otherwise explicitly mentioned in the body of the article, at the time of writing, the author has no position in any stock mentioned in this article and no business relationship with any company mentioned. The author has not received compensation for writing this article, other than from FXStreet.

FXStreet and the author do not provide personalized recommendations. The author makes no representations as to the accuracy, completeness, or suitability of this information. FXStreet and the author will not be liable for any errors, omissions or any losses, injuries or damages arising from this information and its display or use. Errors and omissions excepted.

The author and FXStreet are not registered investment advisors and nothing in this article is intended to be investment advice.

Recommended content


Recommended content

Editors’ Picks

EUR/USD clings to daily gains above 1.0650

EUR/USD clings to daily gains above 1.0650

EUR/USD gained traction and turned positive on the day above 1.0650. The improvement seen in risk mood following the earlier flight to safety weighs on the US Dollar ahead of the weekend and helps the pair push higher.

EUR/USD News

GBP/USD recovers toward 1.2450 after UK Retail Sales data

GBP/USD recovers toward 1.2450 after UK Retail Sales data

GBP/USD reversed its direction and advanced to the 1.2450 area after touching a fresh multi-month low below 1.2400 in the Asian session. The positive shift seen in risk mood on easing fears over a deepening Iran-Israel conflict supports the pair.

GBP/USD News

Gold holds steady at around $2,380 following earlier spike

Gold holds steady at around $2,380 following earlier spike

Gold stabilized near $2,380 after spiking above $2,400 with the immediate reaction to reports of Israel striking Iran. Meanwhile, the pullback seen in the US Treasury bond yields helps XAU/USD hold its ground.

Gold News

Bitcoin Weekly Forecast: BTC post-halving rally could be partially priced in Premium

Bitcoin Weekly Forecast: BTC post-halving rally could be partially priced in

Bitcoin price shows no signs of directional bias while it holds above  $60,000. The fourth BTC halving is partially priced in, according to Deutsche Bank’s research. 

Read more

Week ahead – US GDP and BoJ decision on top of next week’s agenda

Week ahead – US GDP and BoJ decision on top of next week’s agenda

US GDP, core PCE and PMIs the next tests for the Dollar. Investors await BoJ for guidance about next rate hike. EU and UK PMIs, as well as Australian CPIs also on tap.

Read more

Forex MAJORS

Cryptocurrencies

Signatures