Nvidia Stock Price and Forecast: NVDA underperforms market again on Wednesday
- Nvidia stock has been in a downturn since August 4.
- Things grew worse when it revised Q3 revenue down on August 24.
- New US government sanctions will hurt NVDA sales in China.
UPDATE: A day after the September 13, inflation-induced mayhem, Nvidia is once again proving that it is weaker relative to the market. NVDA shares are down 0.5% half an hour into the session, while the Nasdaq Composite is actually up by the same amount. Despite the market-wide recovery (all three major indices are ahead by less than a percentage point), Nvidia stock still looks weak. Typically, higher beta stocks will outperform the indices on green days, but Nvidia is trading as if the market is performing a reassessment. The future of much higher interest rate increases over the next three to four months due to persistant inflation has the usual suspects deciding not to buy this dip. Put contracts expiring September 23 for the $132 strike price have risen more than 8% on Wednesday to a price per share of $6.18. 332 contracts have traded at this strike so far in the session.
Nvidia (NVDA) stock charts are pointing to further weakness ahead. After losing 9.5% on Tuesday, much worse than the Nasdaq's dreadful 5.5% finish, fans seem to be growing more skeptical of the leader among US semiconductor designers. The cause for Tuesday's capitulation trade was the worse than expected inflation reading that was released before the market opened. Though the headline figure was not terrible, core inflation (excluding energy and food) rose 0.6% MoM. This showed that inflation was likely to be much harder to tame and would require the Fed to raise interest rates higher than expected.
NVDA stock is trading up 1.2% at $132.82 in Wednesday's premarket.
Nvidia stock news
This is basically an interest rate story. As interest rates rise, risk-free treasury bills and bonds have a better risk-return profile than equities. This means institutional investors are likely to cut some of their equity holdings to buy treasuries and wait out the storm. Additionally, higher treasury yields mean that future profits are discounted at a higher rate (see Discounted Cash Flow Model), which makes stocks like Nvidia that depend on much higher future profits less attractive. Nvidia is currently trading at a P/E of 30 and a forward P/E around 38 while its sector trades at a forward multiple closer to 17. This means there is plenty of room for multiple compression.
Nvidia is still suffering fallout from its drastically lowered revenue guidance for Q3 of $5.9 billion due to continued deceleration in the gaming segment. Wall Street had expected $6.9 billion when Nvidia released the reduced outlook during its Q2 earnings call on August 24. Nvidia management has placed most of the blame on the gaming segment, but many outside observers think it stems largely from Ethereum moving away from mining. Once Ethereum becomes non-minable, scheduled for mid-September, Nvidia should lose a large segment of demand for its GPUs.
One positive sign is that Nvidia is working with its primary foundry, Taiwan Semiconductor (TSMC), to build new arrays combining multiple GPUs that will work better for AI processing. The big setback is that the US government is limiting Nvidia from shipping its most up-to-date chips to China in a bid to slow down China's technological advancement. Government agencies think this will limit China's ability to invade Taiwan. In a filing in late August post-earnings, Nvidia said the sanctions may reduce revenue by as much as $400 million.
Also read: Nvidia Stock Deep Dive Analysis: NVDA price target at $205 with strong revenue growth
Nvida stock forecast
As you can see below, NVDA's share price is heading down toward a demand zone situated between $116 and $127. The region is wide, but it held up rather well during the September 2020 through March 2021 period. That period saw NVDA shares begin to create traction and rise above this zone, but multiple sessions saw Nvdia find its footing once again throughout this region. With the stubborn nature of core inflation at the moment, expect the Fed to keep its foot on the pedal. Rates will likely be raised in a more aggressive fashion, and the likelihood of overshooting is high.
Fans are probably already excited to scoop NVDA up around $131, but a much better bet is the bottom of the zone at $116. The Relative Strength Index (RSI) is close to oversold but is not there quite yet.
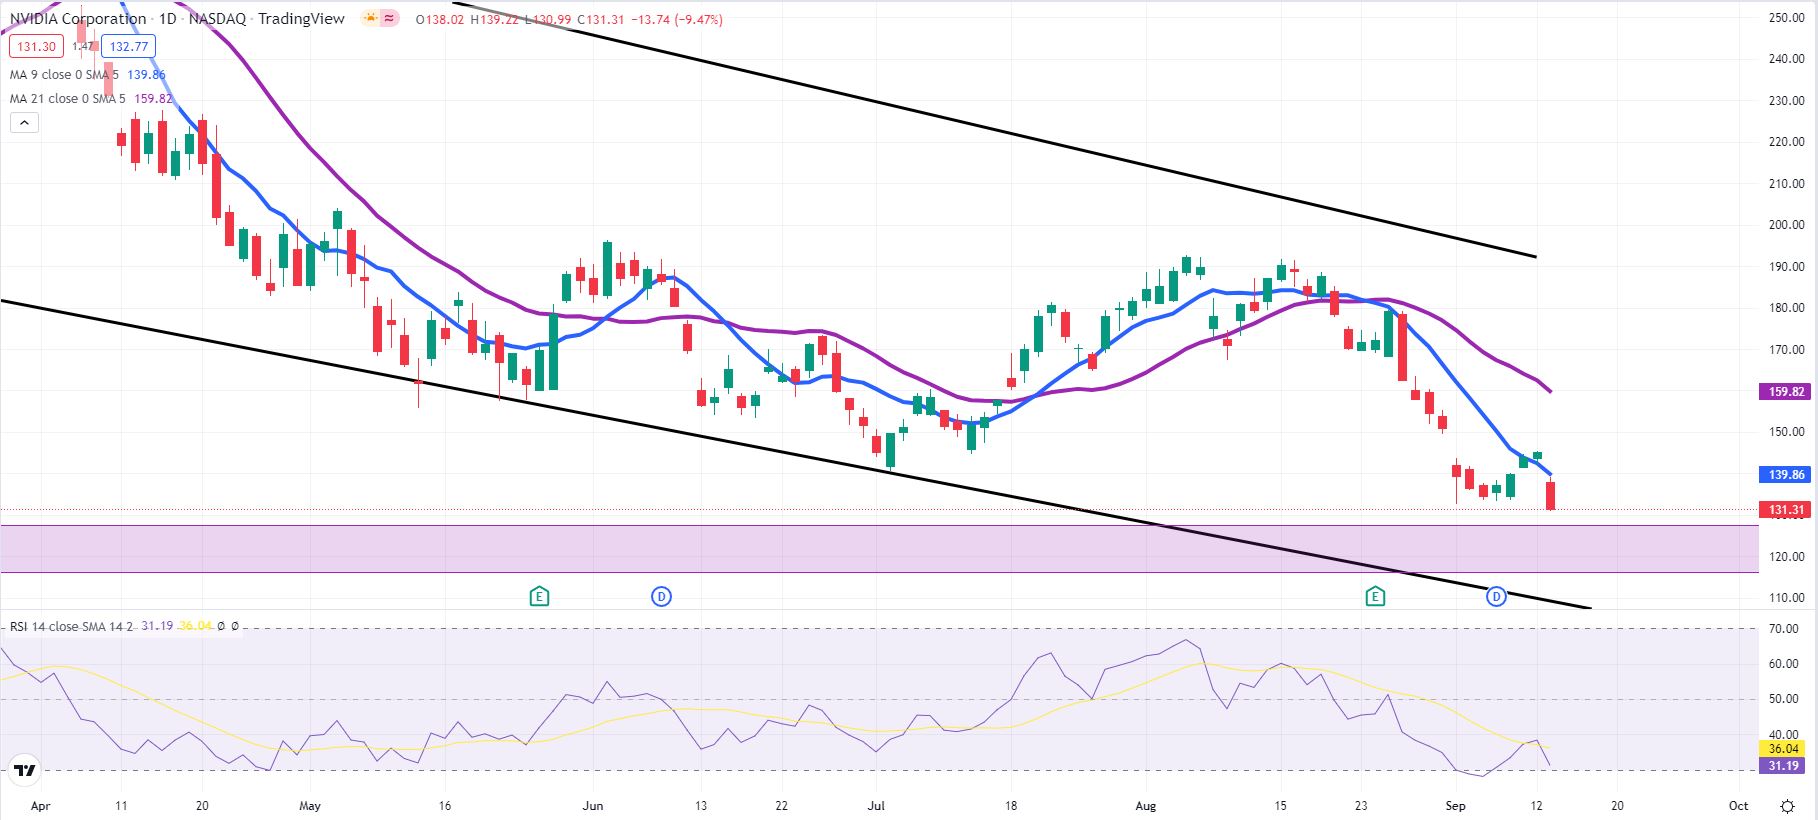
NVDA daily chart
As can be seen on the weekly chart below, the demand zone between $116 and $127 has a lot of volume going for it. If a break of $116 occurs, expect Nvidia to trade all the way to the bottom trendline near $95. I doubt we will be that lucky though!
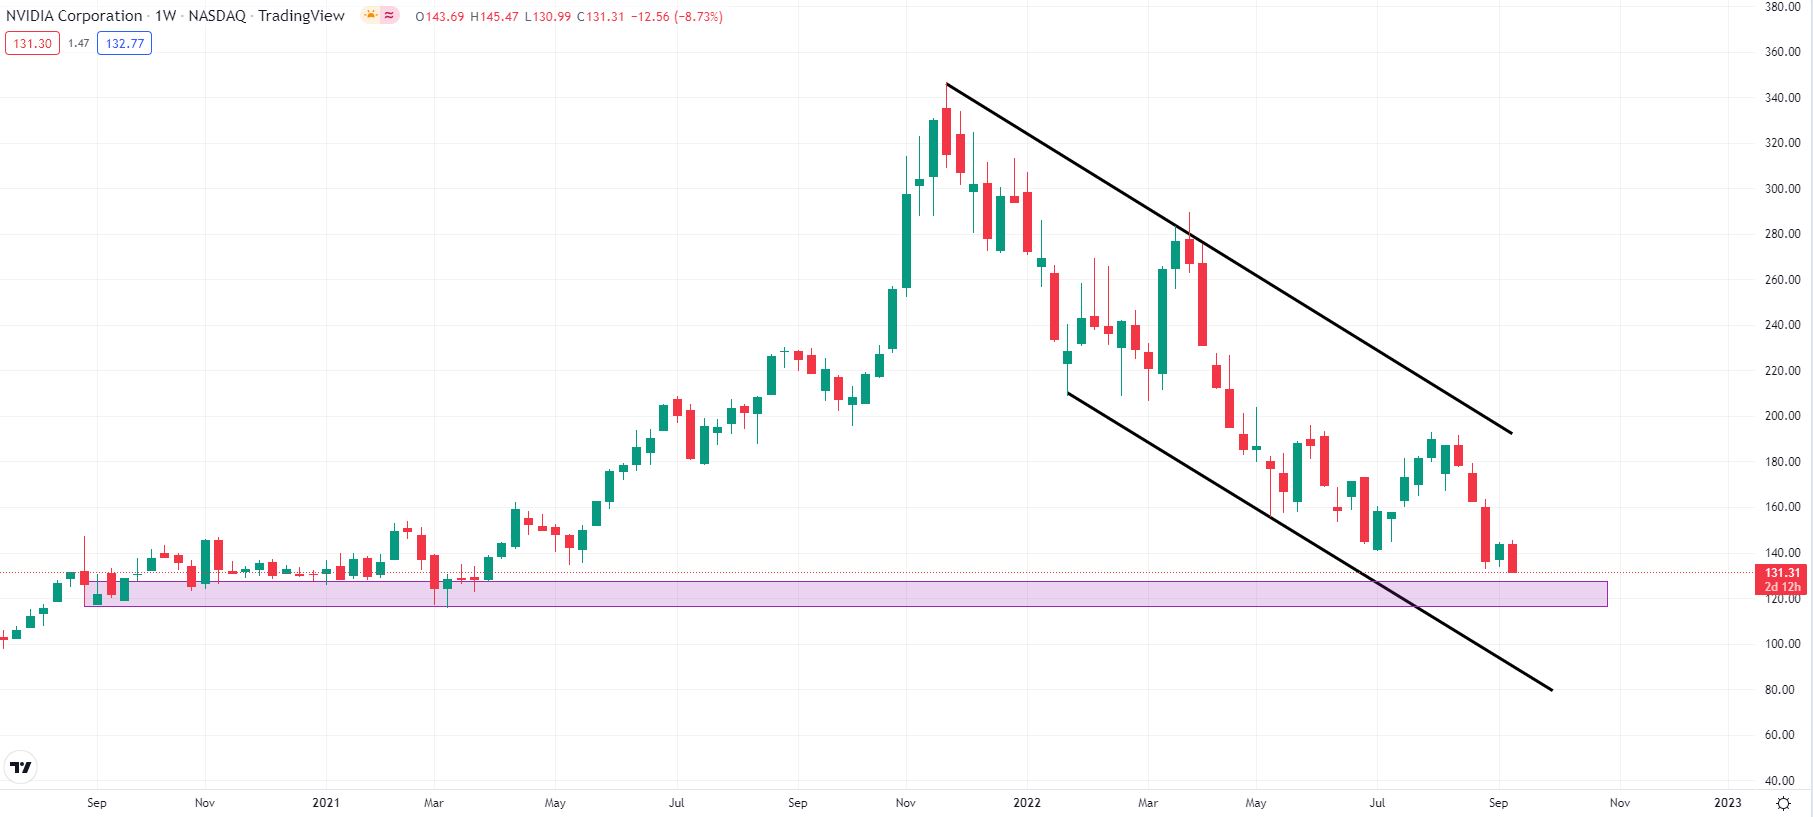
NVDA weekly chart
Premium
You have reached your limit of 3 free articles for this month.
Start your subscription and get access to all our original articles.
Author

Clay Webster
FXStreet
Clay Webster grew up in the US outside Buffalo, New York and Lancaster, Pennsylvania. He began investing after college following the 2008 financial crisis.


