NVIDIA Corp.(NVDA) stocks Elliott Wave technical analysis [Video]
![NVIDIA Corp.(NVDA) stocks Elliott Wave technical analysis [Video]](https://editorial.fxstreet.com/images/Markets/Equities/Industries/CapitalGoods/elevating-boxes-warehouse.jpg)
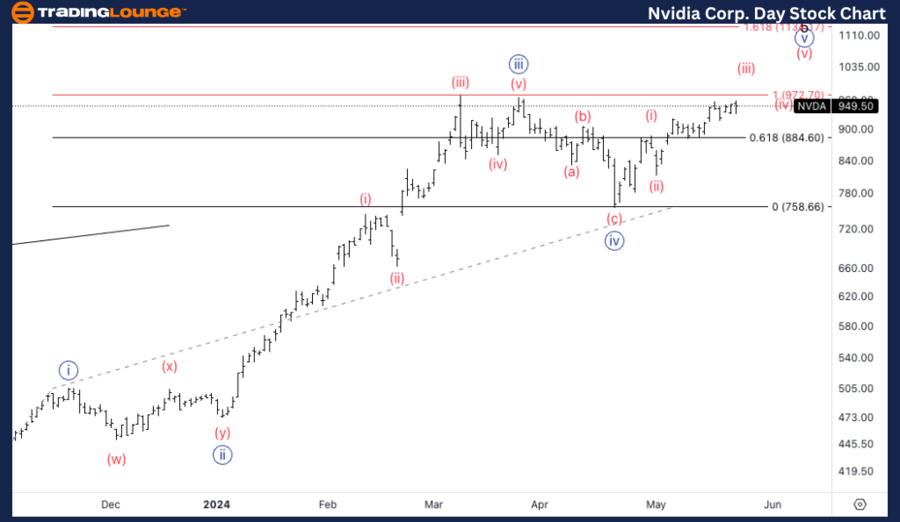
NVDA Elliott Wave Analysis Trading Lounge Daily Chart,
NVIDIA Corp., (NVDA) Daily Chart.
NVDA Elliott Wave technical analysis
Function: Trend.
Mode: Impulsive.
Structure: Motive.
Position: Minute {v}.
Direction: Upside in {v} of 1.
Details: Equality of {v} vs. {i} stands at 972$, looking for resistance on top of TL1 at 1000$.
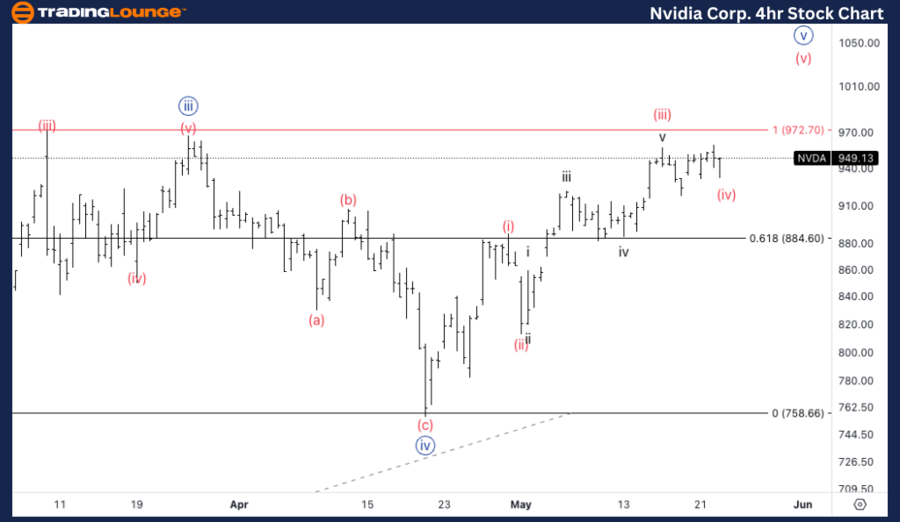
NVDA Elliott Wave Analysis Trading Lounge 4Hr Chart,
NVIDIA Corp., (NVDA) 4Hr Chart.
NVDA Elliott Wave technical analysis
Function: Trend.
Mode: Impulsive.
Structure: Motive.
Position: Wave (v) of {v}.
Direction: Upside in (v).
Details: We seem to be bullish corrective, meaning we should expect further upside. I would start expecting some resistance on the next move up in potential wave (v).
Welcome to our latest Elliott Wave analysis for NVIDIA Corp. (NVDA). This analysis provides a comprehensive look at NVDA's price movements using the Elliott Wave Theory, highlighting potential trading opportunities based on current trends and market structure. We will cover insights from both the daily and 4-hour charts to offer a well-rounded perspective on NVDA's market behavior.
NVDA Elliott Wave technical analysis – Daily chart
In our Elliott Wave analysis of NVIDIA Corp. (NVDA), we observe a strong upward trend characterized by an impulsive structure. NVDA is currently positioned in Minute wave {v} of 1, indicating a continued bullish movement. We are targeting an upside move where the equality of {v} vs. {i} stands at $972, with resistance anticipated at Trading Level 1 (TL1) around $1000. Traders should be mindful of potential resistance at this level, which could signal a temporary pause or correction.
NVDA Elliott Wave technical analysis – Four hour chart
On the 4-hour chart, NVDA is also following an impulsive mode within a motive structure, specifically in wave (v) of {v}. The current analysis suggests a bullish corrective move, implying further upside potential. As NVDA progresses, we anticipate some resistance on the next upward move in wave (v). This resistance could offer strategic entry points for long positions or opportunities to manage existing trades effectively.
Technical analyst : Alessio Barretta.
NVDA Elliott Wave technical analysis [Video]
Author

Peter Mathers
TradingLounge
Peter Mathers started actively trading in 1982. He began his career at Hoei and Shoin, a Japanese futures trading company.


