|

Novo Nordisk (NVO) reacted higher from support area

Novo Nordisk A/S (NVO), a healthcare company engages in the research, development, manufacture & marketing of the pharmaceutical products worldwide. It operates in two segments, Diabetes & Obesity care & Biopharm. It is based in Denmark, comes under Healthcare – Biotechnology sector & trades as “NVO” ticker at NYSE.

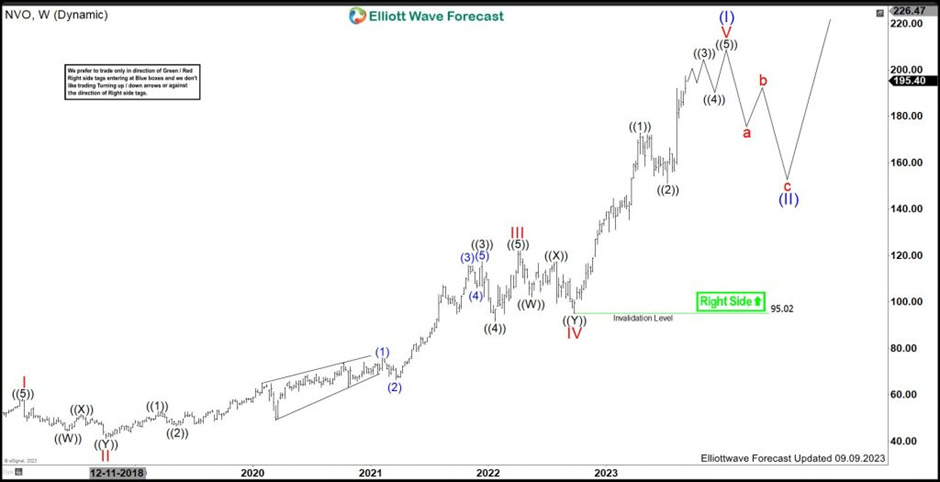
As mentioned in the previous article, it favors higher in V of (I) of ((III)) & expected to find support from the blue box area to resume higher as impulse. It reacted from the blue box area as expected & can see further upside in (3) of ((3)) of V. Any buyers from the blue box area, are now having risk free position.

NVO – Elliott Wave view from 5.29.2023

Chart

It placed wave ((II)) at $30.89 low in 2016 & resume higher in (I) of ((III)). It placed wave I at $58.37 high & II at $41.23 low as 0.618 Fibonacci retracement. Above there, it extended higher in third wave extension, which ended as III at $122.16 high & IV at $95.02 low. Currently, it favors higher in ((3)) of V of (I) & expect short term upside to continue.

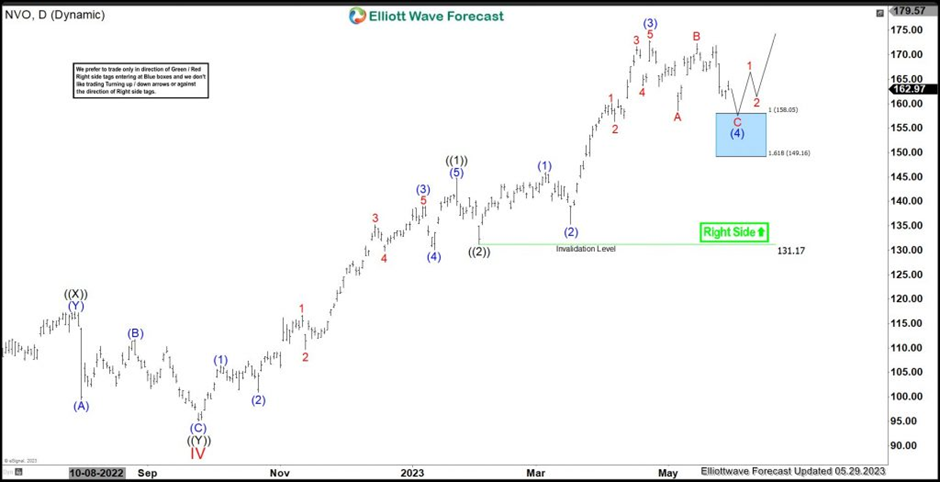
NVO – Elliott Wave latest daily view

Chart

In wave V, it placed ((1)) at $172.97 high, in which, it placed (1) at $144.78 high, (2) at 131.17 low, (3) at 171.70 high, (4) at 163.73 low & (5) as ((1)) at 172.97 high. It was expected to find support between the blue box in $158.05 – $149.16 in which it ended ((2)) at $151.12 low. Above ((2)) low, it breaks above ((1)) high, calling for further upside in ((3)) of V. It placed (1) at $166.54 high & (2) at 155.91 low. Currently, it favors higher in 5 of (3) before correcting in (4) of ((3)). It expects to remain supported in next 3, 7 or 11 swings pullback to see more upside. Alternatively, if it erases the momentum divergence in weekly, then it will be the part of III sequence in (I).

NVO – Elliott Wave latest weekly view 

Chart

Author

Elliott Wave Forecast Team

Elliott Wave Forecast Team

ElliottWave-Forecast.com

More from Elliott Wave Forecast Team
Share:

Editor's Picks

EUR/USD trims losses, back to 1.1830

EUR/USD manages to regain some composure, leaving behind part of the earlier losses and reclaim the 1.1830 region on Tuesday. In the meantime, the US Dollar’s upside impulse loses some momentum while investors remain cautious ahead of upcoming US data releases, including the FOMC Minutes.

GBP/USD bounces off lows, retargets 1.3550

After bottoming out just below the 1.3500 yardstick, GBP/USD now gathers some fresh bids and advances to the 1.3530-1.3540 band in the latter part of Tuesday’s session. Cable’s recovery comes as the Greenback surrenders part of its advance, although it keeps the bullish bias well in place for the day.

Gold remains offered below $5,000

Gold stays on the defensive on Tuesday, receding to the sub-$5,000 region per troy ounce on the back of the persistent move higher in the Greenback. The precious metal’s decline is also underpinned by the modest uptick in US Treasury yields across the spectrum.

Crypto Today: Bitcoin, Ethereum, XRP upside looks limited amid deteriorating retail demand

The cryptocurrency market extends weakness with major coins including Bitcoin (BTC), Ethereum (ETH) and Ripple (XRP) trading in sideways price action at the time of writing on Tuesday.

UK jobs market weakens, bolstering rate cut hopes

In the UK, the latest jobs report made for difficult reading. Nonetheless, this represents yet another reminder for the Bank of England that they need to act swiftly given the collapse in inflation expected over the coming months. 

Ripple slides to $1.45 as downside risks surge

Ripple edges lower at the time of writing on Tuesday, from the daily open of $1.48, as headwinds persist across the crypto market. A short-term support is emerging at $1.45, but a buildup of bearish positions could further weaken the derivatives market and prolong the correction.