|premium|

Nike (NKE Stock) forecasting: The reaction higher from the blue box area

In this technical blog, we will look at the past performance of 4 hour Elliott Wave Charts of Nike ticker symbol: NKE, which we presented to members at the elliottwave-forecast. In which, the rally from 18 March 2020 low unfolded as an impulse structure. And showed a higher high sequence favored more upside extension to take place. Therefore, we advised members not to sell the stock & buy the dips in 3, 7, or 11 swings at the blue box areas. We will explain the structure & forecast below:

NKE 4 hour Elliott Wave chart

NIKE

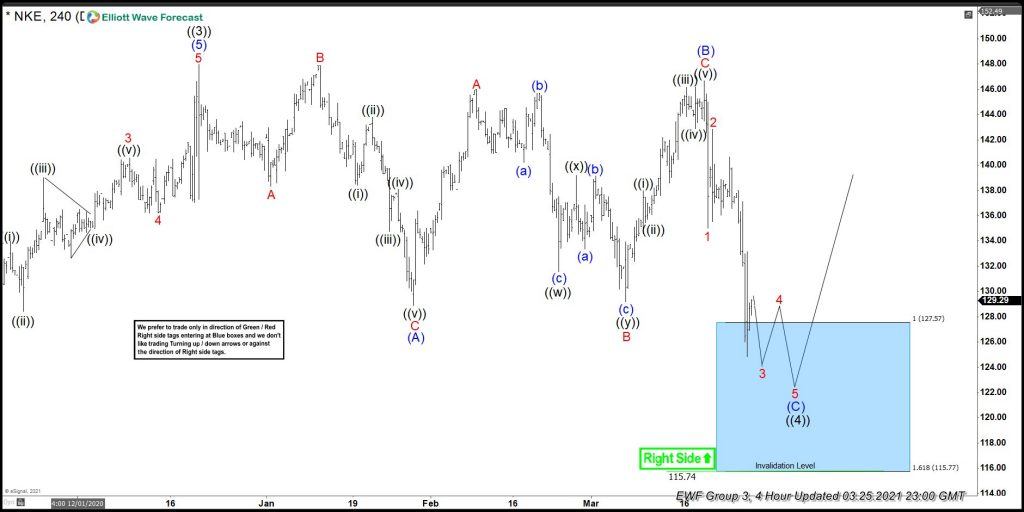
Above is the 4hr Elliott wave Chart from the 3/25/2021 update. In which, the stock ended the bigger wave ((3)) at $147.95 high in an impulse sequence. Down from there, the stock made a bigger pullback in wave ((4)). The internals of that pullback initially thought to be a flat structure where wave (A) ended in 3 waves at $128.91 low. Up from there, the wave (B) bounce ended in a lesser degree flat structure at $146.66 high and started the (C) leg lower in an impulse sequence. And managed to reach the $127.57- $115.77 100%-161.8% Fibonacci extension area of (A)-(B). From where buyers were expected to appear looking for more upside or for a 3 wave bounce at least. (It’s important to note that with further data we were able to adjust the degree of a pullback to a double three instead of a flat correction lower).

NKE latest 4 hour Elliott Wave chart

NKE

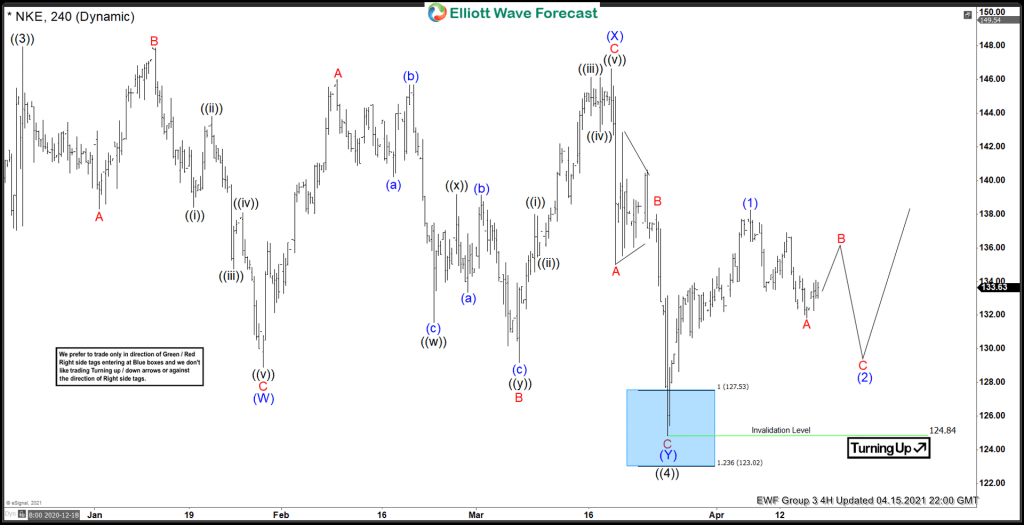
Here’s the latest 4hr Elliott wave Chart from the 4/15/2021 update. In which, the stock managed to reach the blue box area at $127.57- $115.77 & showing a reaction higher taking place from the blue box area. Right after ending the double three correction within the blue box area at $124.84 low. Allowed members to create a risk-free position shortly after taking the long positions at the blue box area. However, a break above $147.95 high still needed to confirm the next extension higher & avoid double correction lower.

Premium

You have reached your limit of 3 free articles for this month.

Start your subscription and get access to all our original articles.

Subscribe to PremiumSign In

Author

Elliott Wave Forecast Team

Elliott Wave Forecast Team

ElliottWave-Forecast.com

More from Elliott Wave Forecast Team
Share:

Editor's Picks

EUR/USD rises to 1.1800 neighborhood amid renewed USD selling and trade uncertainties

The EUR/USD pair regains positive traction during the Asian session on Wednesday and jumps to the 1.1800 neighborhood in the last hour, reversing the previous day's modest losses. The intraday move up is sponsored by the emergence of fresh US Dollar, which continues to be weighed down by persistent trade-related uncertainties.

GBP/USD remains stronger above 1.3500 following Trump’s State of the Union

GBP/USD remains in the positive territory for the fourth successive session, trading around 1.3510 during the Asian hours on Wednesday. The pair appreciates as the US Dollar remains subdued following US President Donald Trump’s first State of the Union address of his second administration before a joint session of Congress.

Gold re-attempts $5,200 amid tariffs and geopolitical woes

Gold buyers are back in the game early Wednesday after seeing a correction from monthly highs on Tuesday. The US Dollar slips after Trump’s SOTU fails to impress and as AI-driven worries ease. Dovish Fed bets also weigh.  Gold looks north so long as the key 61.8% Fibo resistance at $5,142 holds on the daily chart.

Bitcoin, Ethereum and Ripple post cautious recovery amid downside risks

Bitcoin, Ethereum, and Ripple are posting a cautious recovery on Wednesday following a market correction earlier this week.  BTC is approaching a key breakdown level, while ETH and XRP are rebounding from crucial support levels.

The Citrini report: How a debatable AI narrative can shake Wall Street

That AI-related headline alone was enough to rattle investors.US stocks slid sharply on Monday after a widely circulated Citrini Research memo outlined a hypothetical “2028 Global Intelligence Crisis”, warning that rapid AI adoption could push US unemployment into double digits as early as by mid-2028.

XRP pressured by weak ETF flows and declining retail interest

Ripple (XRP) is edging lower, trading above its intraday low of $1.32 at the time of writing on Tuesday. The decline from its weekly opening of $1.39 reflects heightened volatility in the broader cryptocurrency market, accentuated by tariff-triggered uncertainty.