Nike beat on earnings, so why the panic as NKE stock slides 10%?
- Nike released earnings on Thursday, beating on the top and bottom lines.
- Nike reported having higher inventory than wanted.
- NKE fell nearly 10% in afterhours trading.

Nike (NKE) was on the minds of investors Thursday as the sportswear giant unveiled its latest set of quarterly earnings. The headline results looked promising, but the stock still tanked 10% afterhours.
Nike stock news
Earnings per share (EPS) was forecast at $0.92, and it came in at $0.93. The revenue consensus forecast was at $12.2 billion and again the figure came in ahead at $12.7 billion. So far so good, right? Well, the devil is always in the details.
Inventories were up nearly $10 billion versus a year ago, a large increase. Margins were down to 44.3%, nearly two percentage points lower than last year. Margins were hit by logistics costs and that old chestnut, the strong dollar. Get ready for a swath of dollar-related margin issues in the Q3 earnings season. Nike said for 2023 it expects a $4 billion headwind from the strong dollar and a $900 million hit to bottom line EBITDA.
"Based on current spot rates, net of hedging activity, we estimate the full-year negative impact of foreign exchange on reported revenue and EBIT to now be approximately $4 billion and $900 million, respectively, creating a wide divergence in constant versus real dollar performance. [...] For the second quarter specifically, we expect reported revenue to grow low double digits on strong consumer demand despite 900 basis points of foreign exchange headwinds" said Nike CFO Matthew Freind.
Nike stock forecast
Nike was already in a powerful downtrend, and this has only added to it. Post or premarket, whichever is your fancy, Nike stock has cracked the psychological $90 area and then the pandemic support step at $92. This now opens the door to an extended decline to $60, the pandemic low. This is a huge discount to current levels but is the long-term trend.
Adding to the bearish outlook is the fact that Nike stock has cracked the 200-week moving average. This is a feat rarely achieved. The next key support is $84.26. This needs to be watched in the regular session for a reaction from the Relative Strength Index (RSI). Currently, we have a bullish divergence, which could indicate a possible short-term bottom.
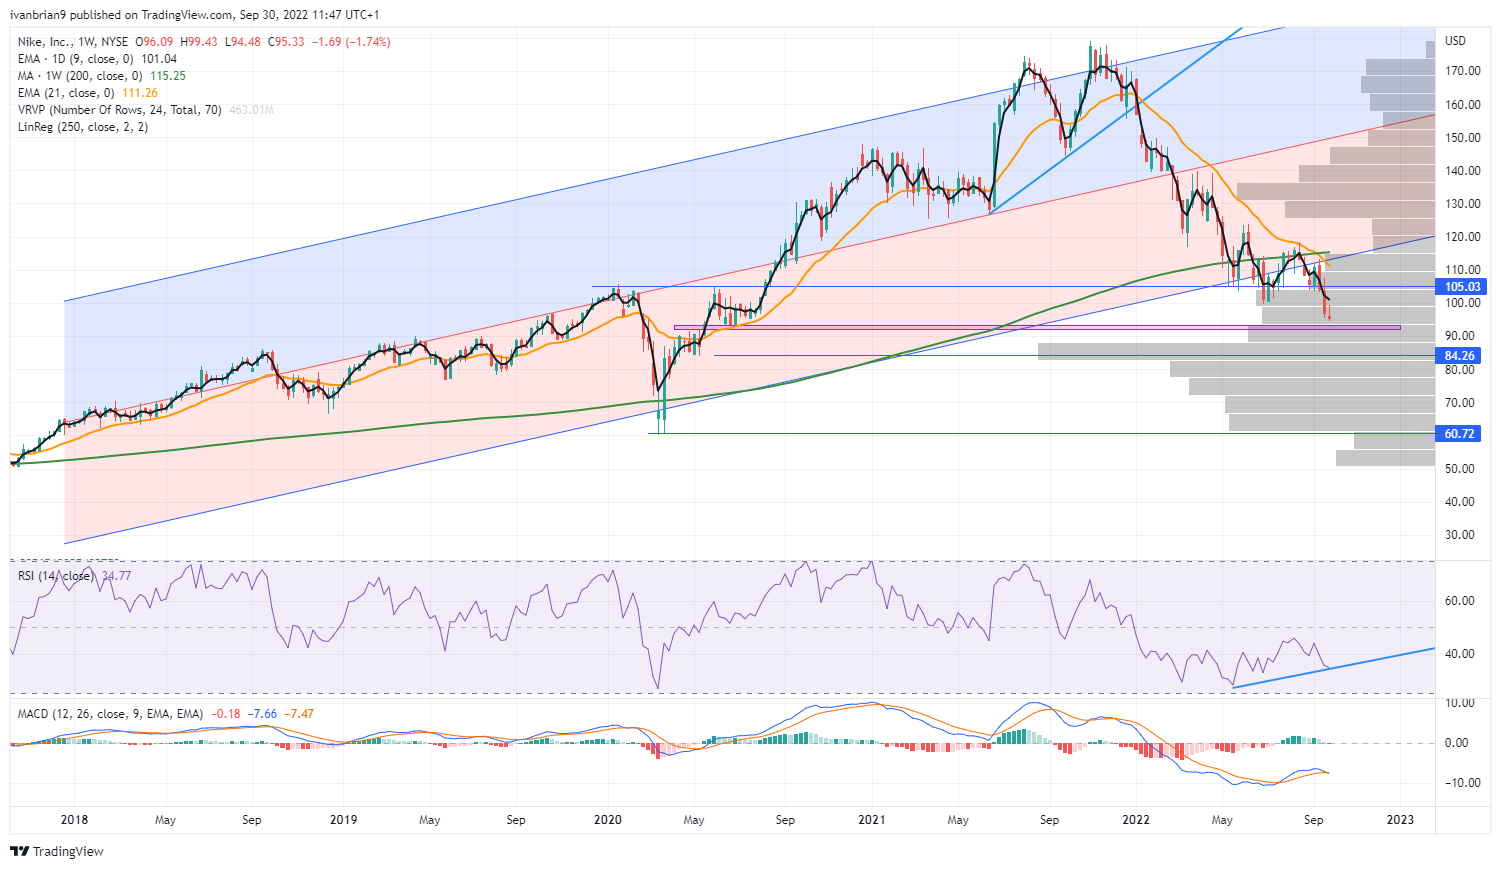
NKE weekly chart
Premium
You have reached your limit of 3 free articles for this month.
Start your subscription and get access to all our original articles.
Author

Ivan Brian
FXStreet
Ivan Brian started his career with AIB Bank in corporate finance and then worked for seven years at Baxter. He started as a macro analyst before becoming Head of Research and then CFO.


