NIFTY 50 INDEX Elliott Wave technical analysis [Video]
![NIFTY 50 INDEX Elliott Wave technical analysis [Video]](https://editorial.fxsstatic.com/images/i/General-Stocks_2_XtraLarge.png)
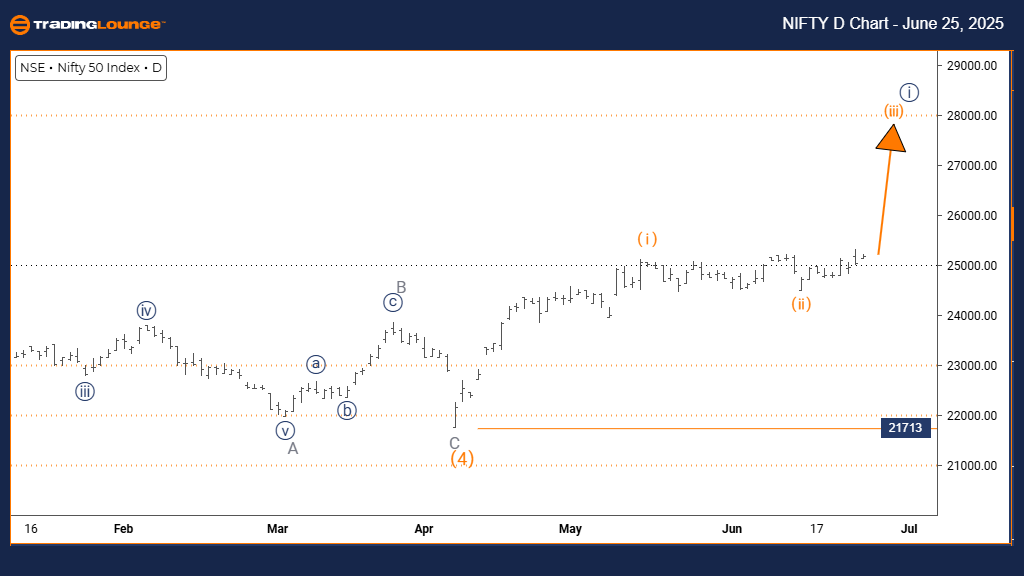
NIFTY 50 INDEX Wave technical analysis
Function: Trend.
Mode: Impulsive.
Structure: Orange Wave 3.
Position: Navy Blue Wave 1.
Direction next higher degrees: Orange Wave 3 (in progress).
Details: Orange Wave 2 appears complete. Orange Wave 3 has begun.
Wave cancel invalid level: 21779.
The daily chart of the NIFTY 50 INDEX, based on Elliott Wave analysis, indicates a bullish trend. The price movement is currently in an impulsive phase, reflecting strong upward momentum. The present wave structure is identified as Orange Wave 3, a segment of a larger pattern – Navy Blue Wave 1. This placement signifies the index is in a strong upward trend within a broader bullish framework.
According to the analysis, Orange Wave 2 has likely finished its corrective movement, transitioning into Orange Wave 3. Typically, this phase is the most extended and powerful in the Elliott Wave cycle, often resulting in notable price increases. Traders should focus on the progression of Orange Wave 3, which evolves under the broader Navy Blue Wave 1.
An important level to monitor is the invalidation point at 21779. A decline below this threshold would nullify the current wave count, necessitating a reevaluation of the bullish perspective. Until then, the wave structure supports a continued upward movement.
The technical configuration suggests the NIFTY 50 INDEX is positioned for a sustained uptrend. With Orange Wave 3 now active post the completion of Orange Wave 2, the impulsive nature of this wave hints at strong buying pressure and a high potential for further gains in the near term.
NIFTY 50 INDEX Wave technical analysis
Function: Bullish Trend.
Mode: Impulsive.
Structure: Navy Blue Wave 1.
Posiion: Gray Wave 1.
Direction next lower degrees: Navy Blue Wave 2.
Details: Orange Wave 4 seems complete. Navy Blue Wave 1 of 1 is currently active.
Wave cancel invalid level: 21779.
The weekly chart analysis of the NIFTY 50 INDEX presents a strong bullish trend. Price action is in an impulsive phase, showing significant upward momentum. The wave structure is currently identified as Orange Wave 3, which is part of a larger pattern – Navy Blue Wave 1. This suggests the index is moving through a strong advancing phase in a wider bullish market trend.
Technical indicators confirm the completion of Orange Wave 2’s corrective cycle, giving way to Orange Wave 3. This segment is generally the most powerful in the Elliott Wave framework, frequently delivering substantial price growth. Analysts should monitor the development of Orange Wave 3 within the broader Navy Blue Wave 1 formation.
A key level to track is the invalidation point at 21779. If prices fall below this threshold, the current bullish outlook would need to be revised. Unless that occurs, the wave setup continues to indicate further upside movement.
The current technical outlook positions the NIFTY 50 INDEX for continued gains, with Orange Wave 3 advancing post-Orange Wave 2. The impulsive traits of this phase suggest strong institutional interest and the likelihood of considerable upward progress in the near term.

NIFTY 50 INDEX Wave technical analysis [Video]
Author

Peter Mathers
TradingLounge
Peter Mathers started actively trading in 1982. He began his career at Hoei and Shoin, a Japanese futures trading company.


