New Zealand Dollar drops against USD after US Producer Price data
- The New Zealand Dollar declines versus the USD after a slew of US macro data points to stubborn inflation.
- Producer Prices in the US rose more than expected in February and lower unemployment claims indicated a stronger labor market.
- Retail sales rose less than expected, providing an antidote to the inflationary PPI data.

The New Zealand Dollar (NZD) is trading lower in its NZD/USD pair on Thursday after the release of US macroeconomic data suggests price pressures are likely to remain elevated.
Producer Prices (PPI) for February came out higher than economists forecasted, according to data from US Bureau of Labour Statistics. It suggests inflation is likely to remain stubbornly high in the US, forcing the Federal Reserve to keep interest rates at their current level for longer, and scotching hopes of an early interest-rate cut.
Higher interest rates are generally positive for a currency because they attract more inflows of foreign capital, so the data weighed on the NZD/USD pair, which measures the buying power of one New Zealand Dollar in US Dollar (USD) terms.
US Retail Sales came out lower than expected, however, providing an antidote to the higher PPI result, as lower demand for shoppers tends to have a disinflationary effect.
At the same time, lower-than-expected US Jobless Claims indicated the possibility of inflationary pressures from a tight labor market.
New Zealand Dollar falls against USD as factory gate inflation beats expectations
The BLS data shows that the Producer Price Index ex Food and Energy (Core PPI) rose by 2.0% in February, not the 1.9% forecast, and the same as the previous 2.0% in January.
Monthly Core PPI showed a 0.3% increase in prices, which beat the 0.2% rise expected but was still lower than the 0.5% from the previous month.
The headline Producer Price Index (PPI) rose 1.6% in February, which was well above the 1.1% YoY gain expected and the 1% in January. MoM PPI rose 0.6% versus the 0.3% forecast – the same as the 0.3% previous.
US Retail Sales registered a 0.6% rise MoM rather than the 0.8% rise forecast, but still above the 0.8% decline in January.
US Initial Jobless Claims for the week of March 8 came out at 209K when a 218K result had been forecast, yet this was lower than the 210K previously.
Technical Analysis: New Zealand Dollar continues falling inside range
The NZD/USD pair continues falling within a range after touching the top of its range in the 0.6220s, where it formed a bearish Shooting Star Japanese candlestick pattern on the 4-hour chart (circled).
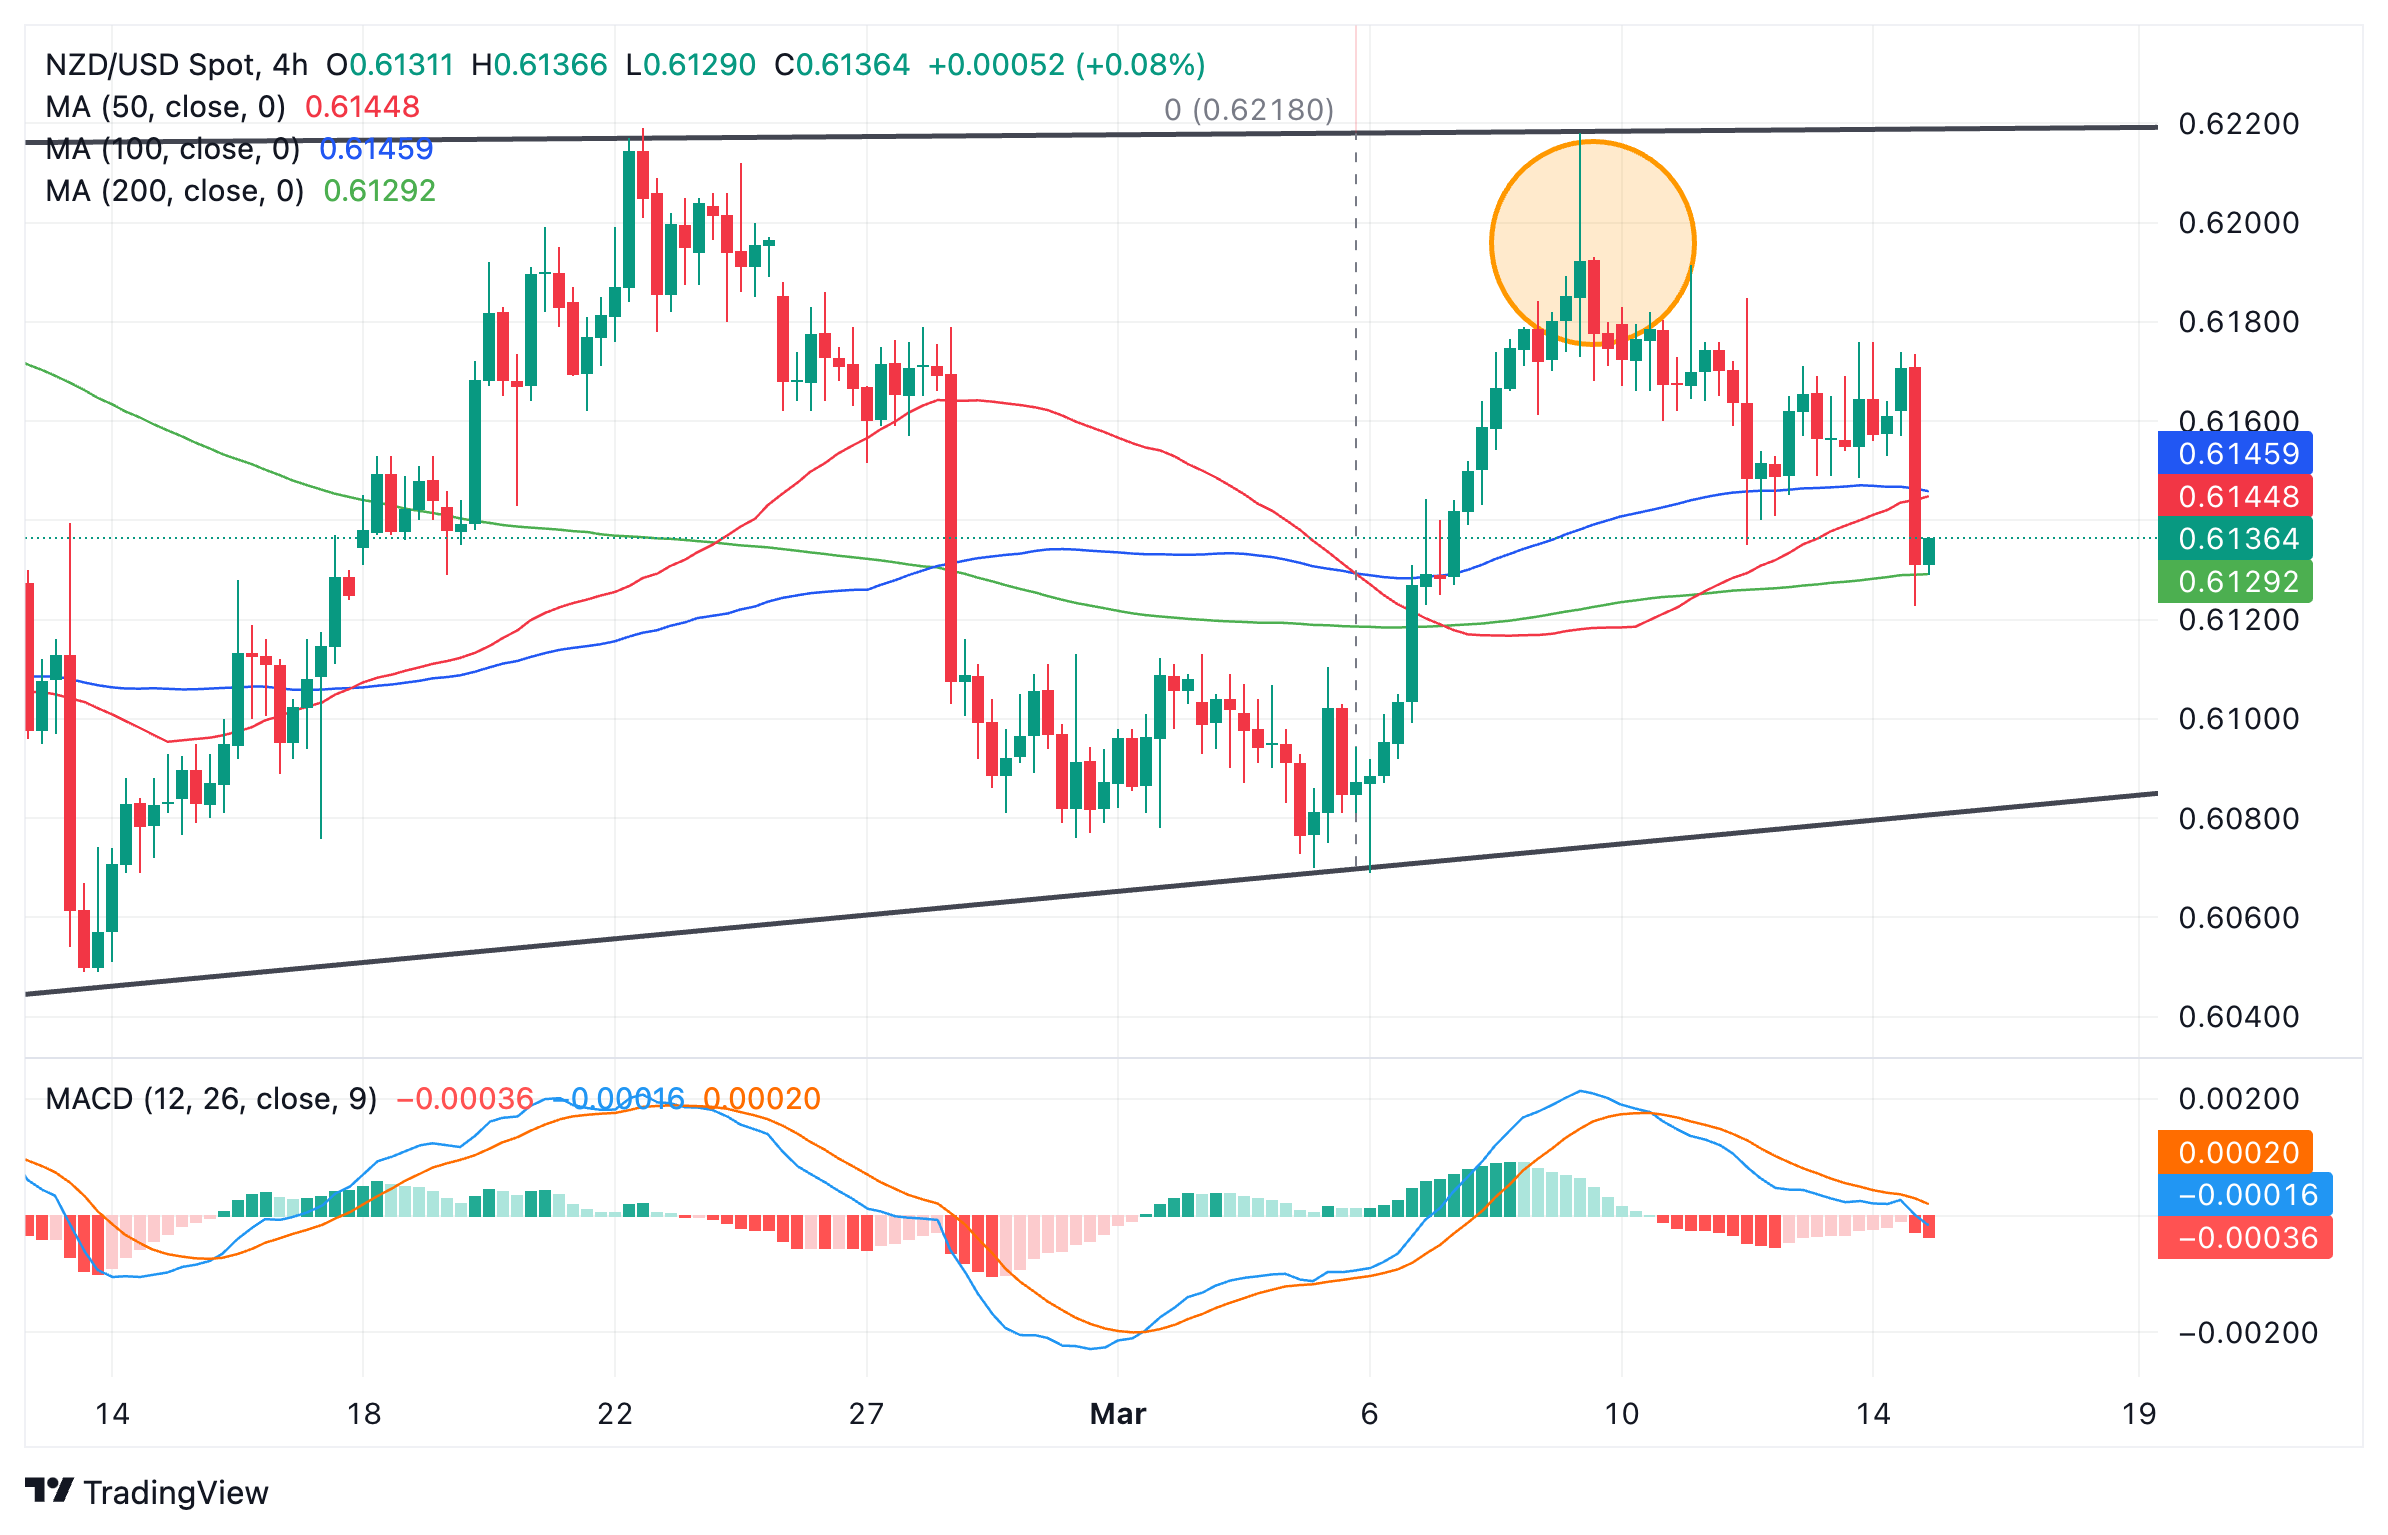
New Zealand Dollar vs US Dollar: 4-hour chart
The combination of the Shooting Star, the range high and the downside move since, suggest the short-term trend has changed, and the pair is descending within its range, back down towards the range lows at around 0.6080-90.
NZD/USD has just pierced a cluster of major moving averages in the lower 0.6100s. A decisive break below the lowest MA, the green 200-4-hour Simple Moving Average (SMA) at 0.6120, will open the space lower.
A break above 0.6190 would suggest bulls have the upper hand again and could signify the pair is preparing to break out from the range.
A break above the range high and the high of the Shooting Star would provide stronger confirmation the market was going higher. Such a move would probably reach a target at 0.6309, the 61.8% Fibonacci extrapolation of the height of the range from the breakout point higher.
New Zealand Dollar FAQs
The New Zealand Dollar (NZD), also known as the Kiwi, is a well-known traded currency among investors. Its value is broadly determined by the health of the New Zealand economy and the country’s central bank policy. Still, there are some unique particularities that also can make NZD move. The performance of the Chinese economy tends to move the Kiwi because China is New Zealand’s biggest trading partner. Bad news for the Chinese economy likely means less New Zealand exports to the country, hitting the economy and thus its currency. Another factor moving NZD is dairy prices as the dairy industry is New Zealand’s main export. High dairy prices boost export income, contributing positively to the economy and thus to the NZD.
The Reserve Bank of New Zealand (RBNZ) aims to achieve and maintain an inflation rate between 1% and 3% over the medium term, with a focus to keep it near the 2% mid-point. To this end, the bank sets an appropriate level of interest rates. When inflation is too high, the RBNZ will increase interest rates to cool the economy, but the move will also make bond yields higher, increasing investors’ appeal to invest in the country and thus boosting NZD. On the contrary, lower interest rates tend to weaken NZD. The so-called rate differential, or how rates in New Zealand are or are expected to be compared to the ones set by the US Federal Reserve, can also play a key role in moving the NZD/USD pair.
Macroeconomic data releases in New Zealand are key to assess the state of the economy and can impact the New Zealand Dollar’s (NZD) valuation. A strong economy, based on high economic growth, low unemployment and high confidence is good for NZD. High economic growth attracts foreign investment and may encourage the Reserve Bank of New Zealand to increase interest rates, if this economic strength comes together with elevated inflation. Conversely, if economic data is weak, NZD is likely to depreciate.
The New Zealand Dollar (NZD) tends to strengthen during risk-on periods, or when investors perceive that broader market risks are low and are optimistic about growth. This tends to lead to a more favorable outlook for commodities and so-called ‘commodity currencies’ such as the Kiwi. Conversely, NZD tends to weaken at times of market turbulence or economic uncertainty as investors tend to sell higher-risk assets and flee to the more-stable safe havens.
Author

Joaquin Monfort
FXStreet
Joaquin Monfort is a financial writer and analyst with over 10 years experience writing about financial markets and alt data. He holds a degree in Anthropology from London University and a Diploma in Technical analysis.


