Netflix (NFLX) Technical Chart Overview: What to expect for earnings due after Tuesday close

Netflix (NFLX) reports earnings after the close on Tuesday. Earnings per share (EPS) is expected to come in at $2.96 for Q1 2021, a gain of 88% YoY. Revenue is expected to come in at $7.13 billion for the quarter.
Netflix is expected to have gained 6 million new subscribers for the Q1 2021 period.
The conference call is due at 1800 EST / 2200 GMT. The link for the live conference call broadcast is here.
Netflix (NFLX) stock forecast
Netflix has been on a stellar run during the pandemic as its business model was perfect for a worldwide stay-at-home lockdown. Subscriber numbers jumped by nearly 16 million in the first quarter of 2020 as the pandemic took hold. NFLX added a further 10 million new subscribers in Q2 2020.
All this growth has seen the Netflix (NFLX) share price rally from $290 in March 2020 to a current price of $554. However, NFLX traded as high as $570 in July 2020, so the share price has struggled for momentum since. Many analysts are expecting people to switch to real-world activities once lockdown completely ends and economies and leisure activities resume normal service. All this would mean less time for Netflix services.
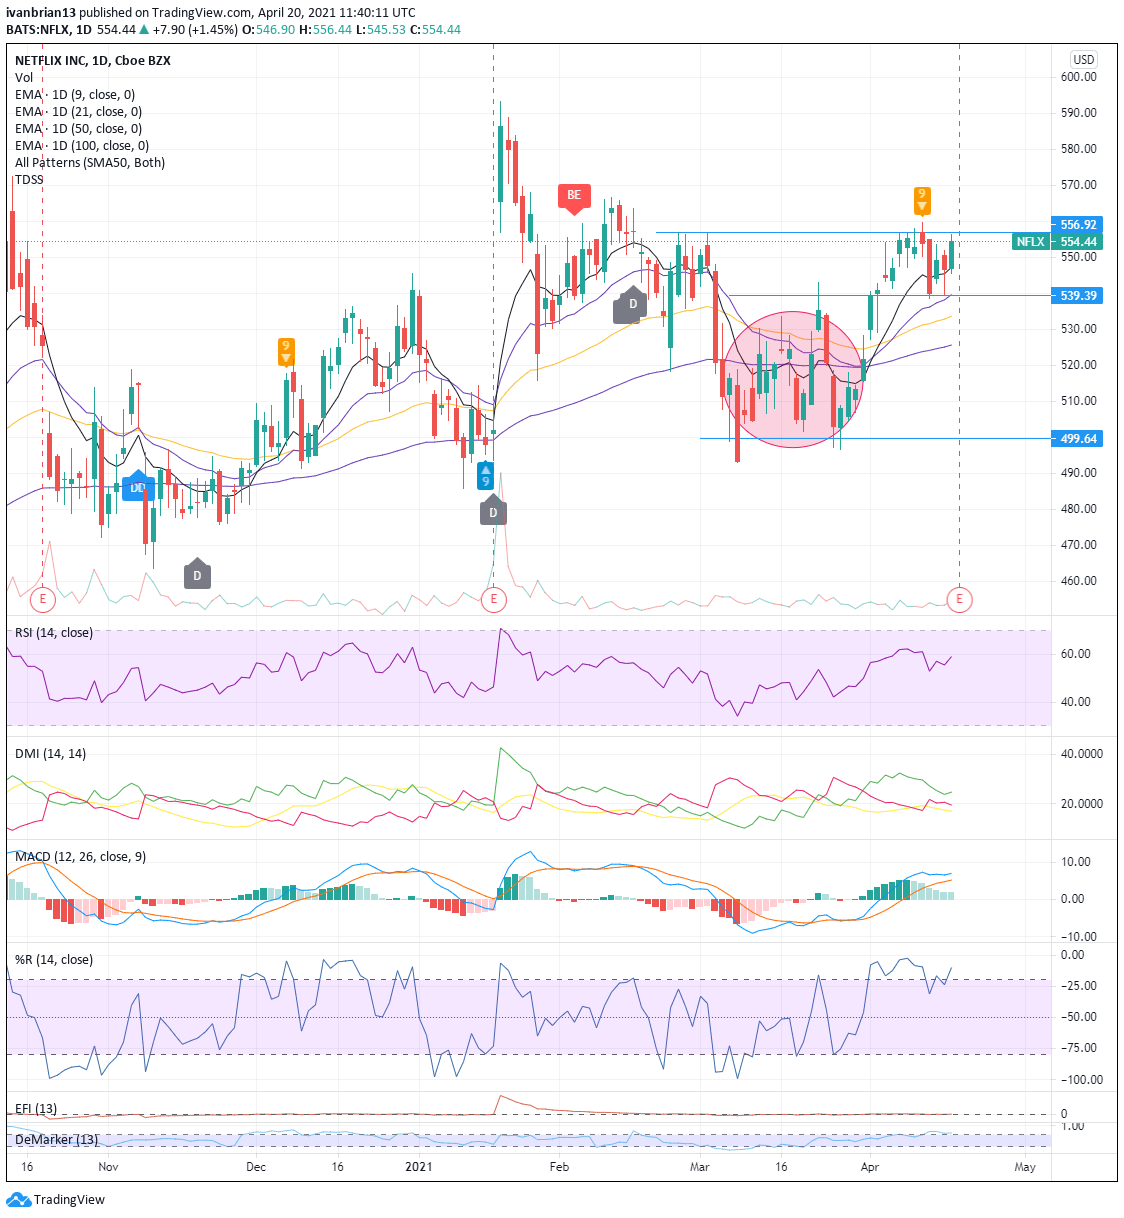
As can be seen from the chart, earnings releases tend to be volatile for Netflix and in many cases disappointing.
Currently, the Moving Average Convergence Divergence (MACD) and the Directional Movement Index (DMI) are both in bullish territory, having given bullish crossover signals on March 31. However, a 9 DeMark sell signal and the Williams oscillator in overbought territory both make for second guessing. So who do we believe? The bullish signal from DMI was not accompanied by a strong trend as the yellow ADX line is not above 25, which indicates a strong trend. This buy signal is weak.
The MACD does however show a crossover buy signal. This MACD signal has now run its course, and the gap is shrinking. We may even get a MACD crossover sell signal shortly. The Williams oscillator is overbought, and the DeMark 9 sell is in place, so overall the indicators are net bearish. But as with any signals, caution is needed as they are not foolproof. NFLX has been capped recently by resistance at $556.92, corresponding to the DeMark sell signal. A break above this level ends the bearishness and will need a reassessment of the indicators and levels.
The first target to break for the price to confirm the bearish indicators is the 9-day moving average and then the 21-day. The 21-day moving average support also corresponds to the entry to a new range sub-$540.
At the time of writing, the author has no position in any stock mentioned in this article and no business relationship with any company mentioned. The author has not received compensation for writing this article, other than from FXStreet.
This article is for information purposes only. The author and FXStreet are not registered investment advisors and nothing in this article is intended to be investment advice. It is important to perform your own research before making any investment and take independent advice from a registered investment advisor.
FXStreet and the author do not provide personalized recommendations. The author makes no representations as to accuracy, completeness, or the suitability of this information. FXStreet and the author will not be liable for any errors, omissions or any losses, injuries or damages arising from this information and its display or use. The author will not be held responsible for information that is found at the end of links posted on this page.
Errors and omissions excepted.
Premium
You have reached your limit of 3 free articles for this month.
Start your subscription and get access to all our original articles.
Author

Ivan Brian
FXStreet
Ivan Brian started his career with AIB Bank in corporate finance and then worked for seven years at Baxter. He started as a macro analyst before becoming Head of Research and then CFO.


