Silver Price Forecast: XAG/USD slides amid a firm US Dollar
- Silver drops 0.63% as stronger US jobs data underpins US Dollar demand.
- Uptrend intact, though RSI flattening signals potential consolidation phase.
- A break below $84.96 exposes the 50-day SMA near $83.81, while $91.31 caps upside.

Silver (XAG/USD) price loses its brightness on Thursday, moving in the opposite direction of Gold, which remains steady as the US Dollar recovers some ground and rises. Stronger-than-expected US jobs data keeps the white metal pressured in the mid-North American session. At the time of writing, XAG/USD trades at $86.83, down 0.63%.
XAG/USD Price Forecast: Technical outlook
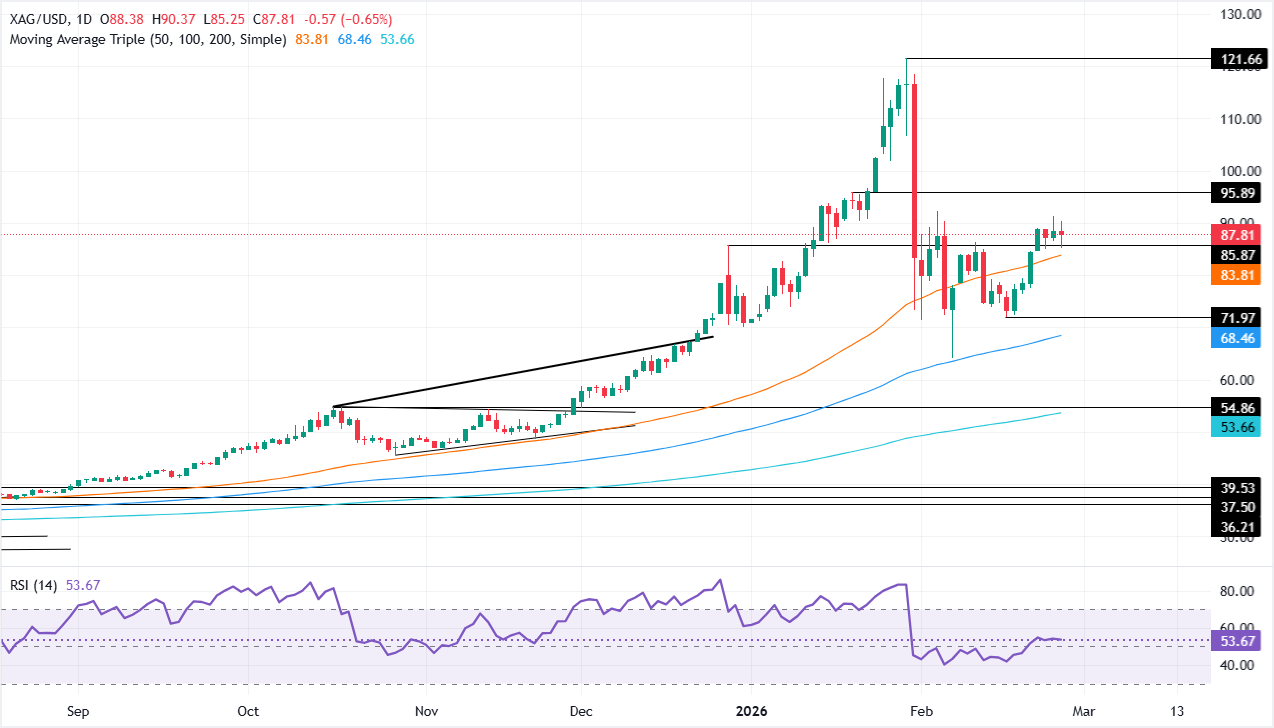
The white metal remains upward biased, despite retreating after reaching a three-week high of $91.31 on Wednesday. Momentum remains bullish as depicted by the Relative Strength Index (RSI), but the index turned flattish, an indication that further consolidation lies ahead.
If XAG/USD clears the top of the range at $91.31, this clears the path to challenge the January 20 high at 95.89. On further strength, the next resistance would be the $100.00 milestone.
On the bearish front, a drop below the February 24 daily low of $84.96 puts into play the 50-day Simple Moving Average (SMA) at $83.81 ahead of the February 17 swing low of $71.97.
XAG/USD Price Chart – Daily
Silver FAQs
Silver is a precious metal highly traded among investors. It has been historically used as a store of value and a medium of exchange. Although less popular than Gold, traders may turn to Silver to diversify their investment portfolio, for its intrinsic value or as a potential hedge during high-inflation periods. Investors can buy physical Silver, in coins or in bars, or trade it through vehicles such as Exchange Traded Funds, which track its price on international markets.
Silver prices can move due to a wide range of factors. Geopolitical instability or fears of a deep recession can make Silver price escalate due to its safe-haven status, although to a lesser extent than Gold's. As a yieldless asset, Silver tends to rise with lower interest rates. Its moves also depend on how the US Dollar (USD) behaves as the asset is priced in dollars (XAG/USD). A strong Dollar tends to keep the price of Silver at bay, whereas a weaker Dollar is likely to propel prices up. Other factors such as investment demand, mining supply – Silver is much more abundant than Gold – and recycling rates can also affect prices.
Silver is widely used in industry, particularly in sectors such as electronics or solar energy, as it has one of the highest electric conductivity of all metals – more than Copper and Gold. A surge in demand can increase prices, while a decline tends to lower them. Dynamics in the US, Chinese and Indian economies can also contribute to price swings: for the US and particularly China, their big industrial sectors use Silver in various processes; in India, consumers’ demand for the precious metal for jewellery also plays a key role in setting prices.
Silver prices tend to follow Gold's moves. When Gold prices rise, Silver typically follows suit, as their status as safe-haven assets is similar. The Gold/Silver ratio, which shows the number of ounces of Silver needed to equal the value of one ounce of Gold, may help to determine the relative valuation between both metals. Some investors may consider a high ratio as an indicator that Silver is undervalued, or Gold is overvalued. On the contrary, a low ratio might suggest that Gold is undervalued relative to Silver.
Author

Christian Borjon Valencia
FXStreet
Markets analyst, news editor, and trading instructor with over 14 years of experience across FX, commodities, US equity indices, and global macro markets.


