Netflix Inc. (NFLX) Elliott Wave technical analysis [Video]
![Netflix Inc. (NFLX) Elliott Wave technical analysis [Video]](https://editorial.fxstreet.com/images/Markets/Equities/Industries/Media/Netflix_XtraLarge.jpg)
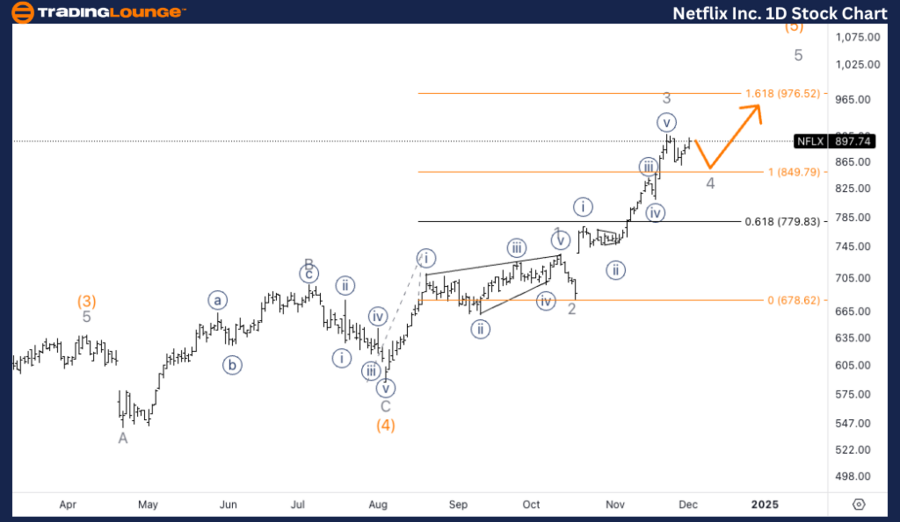
NFLX Elliott Wave technical analysis
Function: Trend.
Mode: Impulsive.
Structure: Motive.
Position: Wave (5).
Direction: Upside within wave 5 of (5).
Details: We are going to present two slightly different counts in today’s special post. This one suggests we are in the middle of a Minor wave 4 after reaching equality of 3 vs. 1 at 850$.
NFLX Elliott Wave technical analysis – Daily chart
Netflix appears to be progressing through wave 5 of (5), indicating the continuation of its impulsive trend. The current wave structure suggests that NFLX reached equality of wave 3 vs. wave 1 at around $850. However, there are two potential wave counts being considered, and one scenario posits that NFLX may currently be in a corrective Minor wave 4, which implies that after a consolidation period, another leg up in wave 5 could follow to complete the overall impulse.
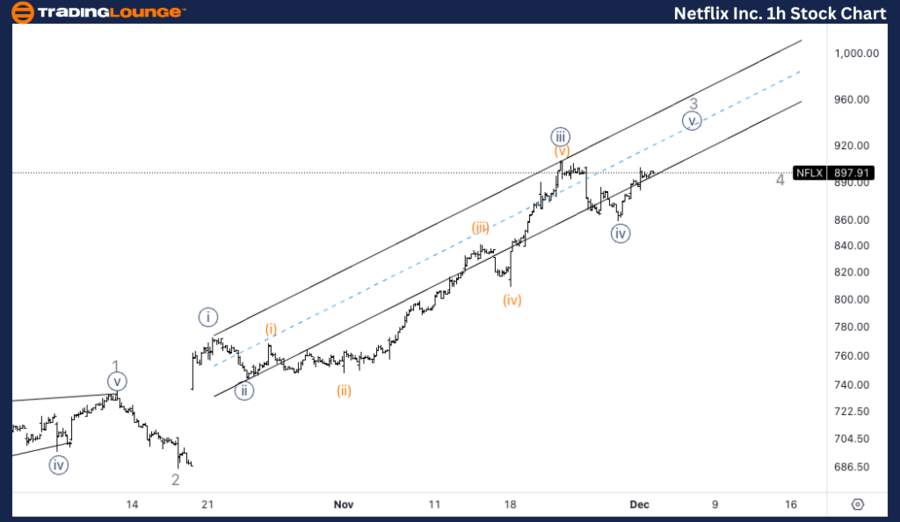
NFLX Elliott Wave technical analysis
Function: Trend.
Mode: Impulsive.
Structure: Motive.
Position: Wave {iv} of 3.
Direction: Upside in wave {v}.
Details: Looking for upside into wave {v} as we can identify an incomplete five wave move within wave 3 and the same applies for wave {iii}.
NFLX Elliott Wave technical analysis – One-hour chart
On the 1-hour chart, NFLX is completing wave {iv} of 3. The chart indicates that wave {v} is expected to unfold soon, bringing further upside to complete the overall wave 3. The five-wave structure in wave 3 seems incomplete, as both wave {iii} and wave {v} still require additional upward movement to finalize their respective counts.
In this Elliott Wave analysis, we will review the trend structure of Netflix Inc., (NFLX) using both the daily and 1-hour charts to assess the current wave position and potential price movements.
Netflix Inc. (NFLX) Elliott Wave technical analysis [Video]
Author

Peter Mathers
TradingLounge
Peter Mathers started actively trading in 1982. He began his career at Hoei and Shoin, a Japanese futures trading company.


