Natural Gas sees intraday gains evaporating on another US industrial slowdown
- Natural Gas sees its intraday gains being erased in the US Industrial Production print.
- Traders are quickly taking short-term profit on the rally.
- The US Dollar Index eased a touch and offers a window of opportunity for Gas to recover a touch.

Natural Gas (XNG/USD) is falling back to $1.66, coming from $1.71 earlier this Thursday. The whipsaw move comes on the back of disappointing US Industrial Production numbers for January. Not only got the previous number revised down from 0.1% to 0%, the current number for January even fals into contraction at -0.1%.
The US Dollar (USD) is retreating firmly and is near erasing its gains from Tuesday. This puts the US Dollar Index (DXY) back to square one with Retail Sales undershooting estimates and downward revisions the main driver for this paring back of gains. The US Dollar is retreating against most major peers while risk sentiment is picking up.
Natural Gas is trading at $1.67 per MMBtu at the time of writing.
Natural Gas market movers: US Industrial Production confirms tepid demand ahead
- US Industrial Production falls by -0.1% for January. With the downward revision of the previous number, risk is that the US will start to ease its demand as well for Natural Gas.
- European Gas reserves are above 65%, which means the EU has less than half to restock before the next heating season kicks in.
- Turkish state energy grid-operated Botas is deepening its ties with Egyptian Natural Gas Holding Company. An agreement is on the table and will include sharing each other's infrastructure and underground storage.
- Recent numbers out of Europe show that wind energy is starting to take over energy production from Natural Gas.
- Not only in Europe, but in South Korea strategic reserves are still at elevated levels, seeing tepid demand over the summer to restock ahead of the next heating season.
Natural Gas Technical Analysis: In the blink of an eye
Natural Gas is having a breather today, being up over 1.5% in a purely technical move higher. The reason for this uptick comes with the relentless selling pressure Gas prices have been facing, which now see some profit taking by short sellers. Add the inverse correlation with the US Dollar, which is a touch softer this Thursday, and a window of opportunity is offered for Gas prices to erase a little bit of thier overall loss in February.
On the upside, Natural Gas is facing some pivotal technical levels to get back to. First, $1.99, which saw an accelerated decline. Next is the blue line at $2.13 with the triple bottoms from 2023. In case Natural Gas sees sudden demand pick up, possibly $2.40 could come into play.
Keep an eye on $1.80, which was a pivotal level back in July 2020 and should act as a cap now. Should US President Biden’s moratorium be lifted, together with the additional supply from Canada – which is exporting more to fill the gap from the US – $1.64 and $1.53 (low of 2020) are targets to look out for.
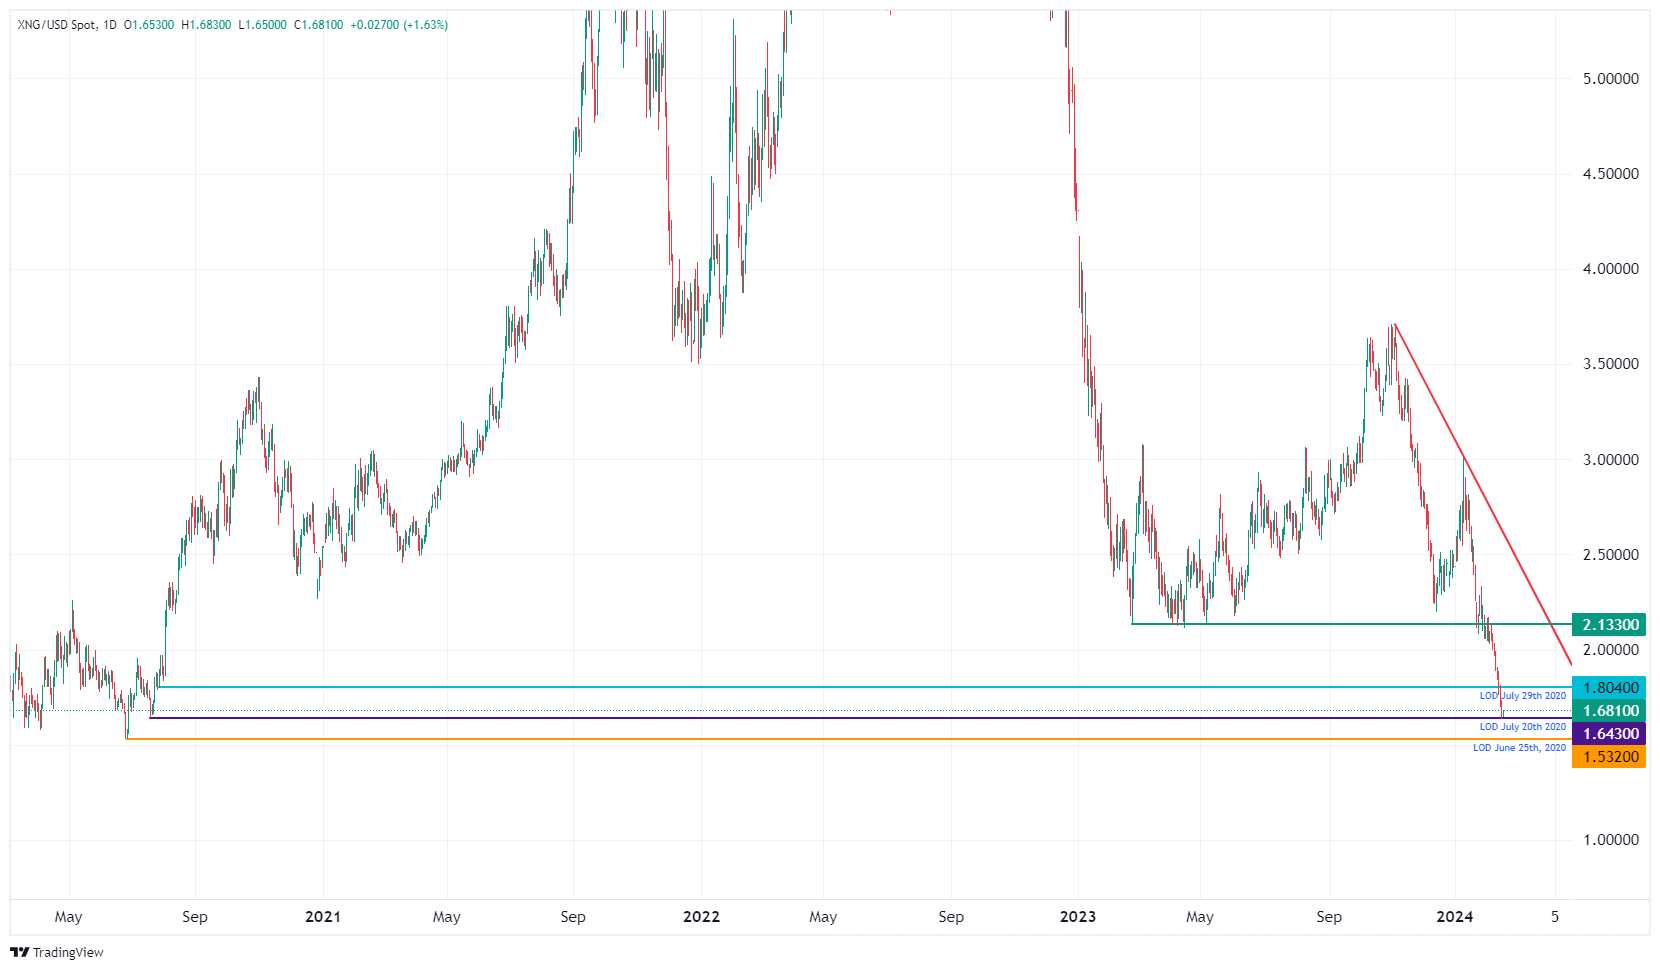
XNG/USD (Daily Chart)
Natural Gas FAQs
What fundamental factors drive the price of Natural Gas?
Supply and demand dynamics are a key factor influencing Natural Gas prices, and are themselves influenced by global economic growth, industrial activity, population growth, production levels, and inventories. The weather impacts Natural Gas prices because more Gas is used during cold winters and hot summers for heating and cooling. Competition from other energy sources impacts prices as consumers may switch to cheaper sources. Geopolitical events are factors as exemplified by the war in Ukraine. Government policies relating to extraction, transportation, and environmental issues also impact prices.
What are the main macroeconomic releases that impact on Natural Gas Prices?
The main economic release influencing Natural Gas prices is the weekly inventory bulletin from the Energy Information Administration (EIA), a US government agency that produces US gas market data. The EIA Gas bulletin usually comes out on Thursday at 14:30 GMT, a day after the EIA publishes its weekly Oil bulletin. Economic data from large consumers of Natural Gas can impact supply and demand, the largest of which include China, Germany and Japan. Natural Gas is primarily priced and traded in US Dollars, thus economic releases impacting the US Dollar are also factors.
How does the US Dollar influence Natural Gas prices?
The US Dollar is the world’s reserve currency and most commodities, including Natural Gas are priced and traded on international markets in US Dollars. As such, the value of the US Dollar is a factor in the price of Natural Gas, because if the Dollar strengthens it means less Dollars are required to buy the same volume of Gas (the price falls), and vice versa if USD strengthens.
Author

Filip Lagaart
FXStreet
Filip Lagaart is a former sales/trader with over 15 years of financial markets expertise under its belt.