Natural Gas Price Analysis: Approaches two-year low at $2.10 despite a less-than-expected drawdown


Share:
  • Natural Gas is oscillating near its fresh two-year low at $2.09 amid a weak demand outlook.
  • The US EIA reported a drawdown in natural gas inventory by 47 billion cubic feet (bcf), lower than the consensus of -54bcf.
  • The extension of winter in northern America has postponed the requirement of ACs due to which demand for natural gas might remain weak.

Natural Gas futures are hovering near their fresh two-year low at $2.09 in the Asian session. The asset witnessed a steep fall on Thursday despite a less-than-anticipated drawdown reported by the United States Energy Information Administration (EIA) for the week ending March 24.

The US EIA reported a drawdown in natural gas inventory by 47 billion cubic feet (bcf), lower than the consensus of -54bcf and the former release of 72bcf. The extension of winter in northern America has postponed the requirement for air conditioners to which demand for natural gas is expected to remain weak, which is weighing heavily on natural gas prices. Also, declining oil prices will get benefit from natural gas substitution ahead.

Meanwhile, the US Dollar Index (DXY) is displaying a subdued performance ahead of the United States core Personal Consumption Expenditure (PCE) Price Index data.

Natural Gas price weekly chart

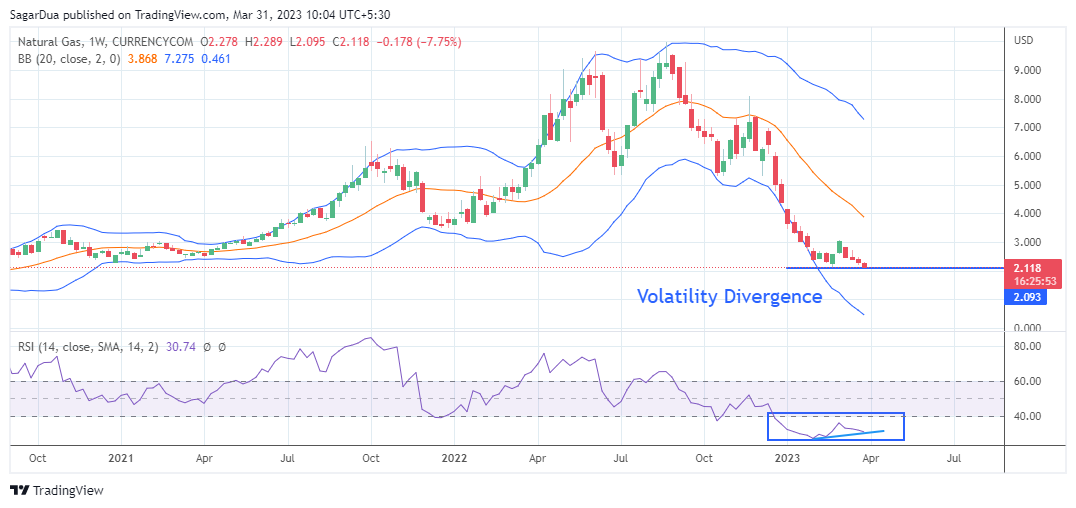
On a weekly scale, Natural Gas futures are showing signs of volatility divergence. The asset has gone a little far from the lower Bollinger Bands (20,2), which indicates that volatility has been squeezed. Also, the Relative Strength Index (RSI) (14) is displaying a divergence in the downside momentum.

The asset has formed a lower low while the momentum oscillator has not made a lower low yet. However, investors are required to use more filters for building bullish bias.

Natural Gas price hourly chart

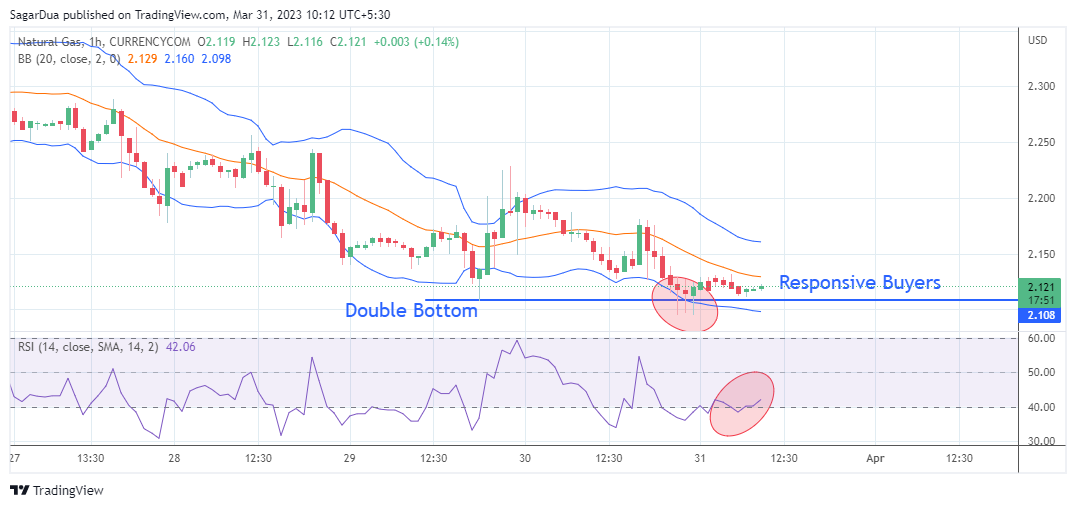
On an hourly scale, Natural Gas futures have shown some signs of responsive buying near the critical support of $2.11, which could result in a Double Bottom chart pattern but still eyes more filters for confidence.

For an upside move, the asset needs to break above the immediate resistance of $2.20, which will drive the asset towards March 28 high around $2.25 followed by March 27 high at $2.29.

On the flip side, a break below March 30 low at $2.09 would expose the asset to fresh two-year low near the psychological resistance at $2.00.


Share: Feed news

Information on these pages contains forward-looking statements that involve risks and uncertainties. Markets and instruments profiled on this page are for informational purposes only and should not in any way come across as a recommendation to buy or sell in these assets. You should do your own thorough research before making any investment decisions. FXStreet does not in any way guarantee that this information is free from mistakes, errors, or material misstatements. It also does not guarantee that this information is of a timely nature. Investing in Open Markets involves a great deal of risk, including the loss of all or a portion of your investment, as well as emotional distress. All risks, losses and costs associated with investing, including total loss of principal, are your responsibility. The views and opinions expressed in this article are those of the authors and do not necessarily reflect the official policy or position of FXStreet nor its advertisers. The author will not be held responsible for information that is found at the end of links posted on this page.

If not otherwise explicitly mentioned in the body of the article, at the time of writing, the author has no position in any stock mentioned in this article and no business relationship with any company mentioned. The author has not received compensation for writing this article, other than from FXStreet.

FXStreet and the author do not provide personalized recommendations. The author makes no representations as to the accuracy, completeness, or suitability of this information. FXStreet and the author will not be liable for any errors, omissions or any losses, injuries or damages arising from this information and its display or use. Errors and omissions excepted.

The author and FXStreet are not registered investment advisors and nothing in this article is intended to be investment advice.

Follow us on Telegram

Stay updated of all the news

Join Telegram

Recommended content


Follow us on Telegram

Stay updated of all the news

Join Telegram

Recommended content

Editors’ Picks

AUD/USD tumbles to breach 0.6500 as poor China's PMI offsets upbeat Aussie data

AUD/USD tumbles to breach 0.6500 as poor China's PMI offsets upbeat Aussie data

AUD/USD is seeing intense selling pressure and breaches 0.6500 after the Chinese NBS Manufacturing PMI sank further into contraction in May. Investors shrugged off hot Australian inflation data and strong Construction Work figures amid resurfacing China economic worries. 

AUD/USD News

EUR/USD battles 1.0700 as China worries lift the US Dollar

EUR/USD battles 1.0700 as China worries lift the US Dollar

EUR/USD is testing 1.0700, retreating from near the 1.0740 region in Wednesday's Asian trading. Dismal China's NBS Manufacturing PMI and pre-US debt deal vote anxiety reinstate the US Dollar's safe-haven appeal. US/ German data, Fedspeak and House vote in focus. 

EUR/USD News

Gold: Bear Cross confirmation to threaten 100 DMA support again Premium

Gold: Bear Cross confirmation to threaten 100 DMA support again

Gold price is fading the previous rebound above the $1,950 mark, as the United States Dollar (USD) is seeing a fresh uptick amid a risk-on market profile. Attention now turns toward the House of Representatives vote on the US debt deal.

Gold News

New SHIB investors bring deposits to the network but fail to trigger a rise in Shiba Inu price

New SHIB investors bring deposits to the network but fail to trigger a rise in Shiba Inu price

Shiba Inu price is still facing consolidation after nearly a month of no major gains, and it seems like this might be the case for a while. Even though the network is observing bullish interest from new investors, the lack of bullishness from existing SHIB holders might act as a barrier to recovery.

Read more

Debt ceiling deal keeps dollar locked in devaluation spiral

Debt ceiling deal keeps dollar locked in devaluation spiral

Fiscal hawks weren't optimistic when Kevin McCarthy was elected Speaker of the U.S. House. The California Republican's track record was dismal when it comes to spending restraint. Nearly 5 months into his term, it is now apparent McCarthy has no intention of holding the line against government expansion.

Read more

Forex MAJORS

Cryptocurrencies

Signatures