Nasdaq 100 Elliott Wave update: An unexpected detour, but still on track
In our previous update, we found that by using the Elliott Wave (EW) Principle for the NASDAQ 100 (NDX)
“…the index is most likely advancing in the 3rd of a 3rd wave (orange W-3 of gray W-iii) for the final 5th wave (green W-5)…. Contingent on price remaining above the warning levels, ... Here, the standard impulse pattern is shown; however, the green W-5 can also develop into an overlapping ending diagonal (ED), resulting in an overlapping rally to the lower end of the target zone (~27860).”
Fast forward to today. The index peaked at 25873 (orange W-1) on January 13 and unexpectedly dropped to 24954 on Tuesday (orange W-2), right at the 76.4% retracement of the December-January rally (lower end of the orange Box). See Figure 1 below. Thus, the immediate 3rd of the 3rd-wave scenario was invalidated, turning the index into a more complex setup.
Figure 1. Short-term Elliott Wave count for the NDX
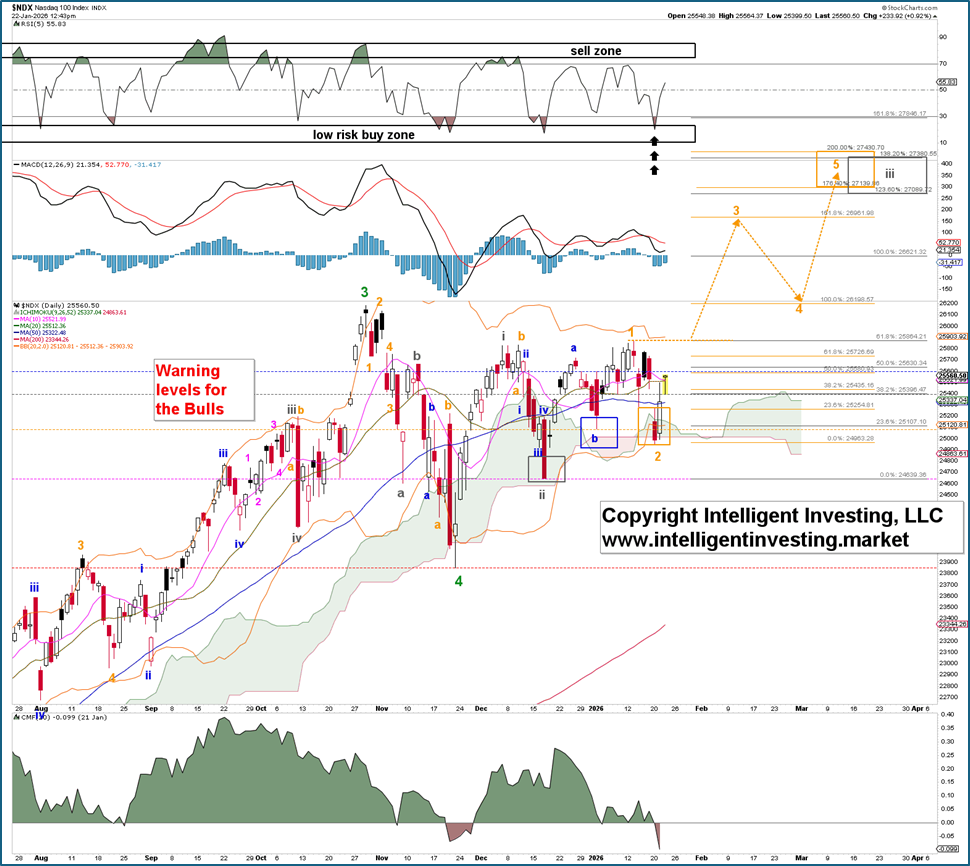
Namely, it appears that the index is morphing into a larger ending diagonal (ED), a 3-3-3-3-3 pattern, as the November-January rally (orange W-1) comprises three waves: blue W-a, -b, and -c. Moreover, W-1 was 0.618x the prior one-degree-higher gray W-i, the November-December rally, a typical ratio.
Thus, the market took a detour but held above the critical warning levels we set, and if it can stay above the December low (24647) and especially the November low (23854), with a serious warning for the Bulls below this week’s low (24954), we can allow for the 3rd of a 3rd wave to kick in. It will be confirmed on a break above the January 13 high and can then ideally target around 26900. See the orange arrows in Figure 1 above.
In our last update, we had no indication that an ED would occur, but with three weeks' worth of additional data, it now appears to be the case. In an ED, the 3rd wave (gray W-iii) typically targets only the 123.6-138.2% extension of the 1st wave. In this case, that would be the 27090-27380 zone. Assuming the W-iii subdivides into five smaller waves, while acknowledging it can be only three due to the nature of EDs, the W-5 of W-iii should ideally reach 27140-27430, which matches perfectly with the aforementioned zone.
*Warning levels for the Bulls: 25602, 25400, 25086, 24647, and 23854. These will be adjusted upwards when the index continues to rise.
Author

Dr. Arnout Ter Schure
Intelligent Investing, LLC
After having worked for over ten years within the field of energy and the environment, Dr.