MRNA Stock Price: Moderna Inc set to retest highs as chart indicators remain bullish
- Moderna has benefited from quick to market COVID-19 vaccine.
- MRNA and Pfizer are the two main vaccines behind the US immunization program.
- MRNA shares have rallied nearly 250% in the last 12 months.
Moderna is a now-familiar name in the world of medicine and to the general public thanks to its development of a COVID-19 vaccine. Moderna produces medicines based on mRNA technology. MRNA has other vaccines using mRNA in its developmental pipeline, but all attention had been to its development of a COVID-19 vaccine. Moderna also has a pipeline of 21 different programs, of which ten have entered clinical studies. Moderna's programs and vaccine development pipeline spans oncology, genetic and cardio vascular diseases.
MRNA stock news
Moderna's share price has had a series of price surges as positive news on its COVID-19 vaccine development has hit the market. Moderna is widely used in the US COVID immunization program and is also used in the EU. Currently, Moderna's vaccine is being reviewed by WHO for emergency use authorization.
Moderna is due to release Q1 2021 results on May 6th. Earnings per share are forecast to be $2.57 on revenue of $2.19 billion.
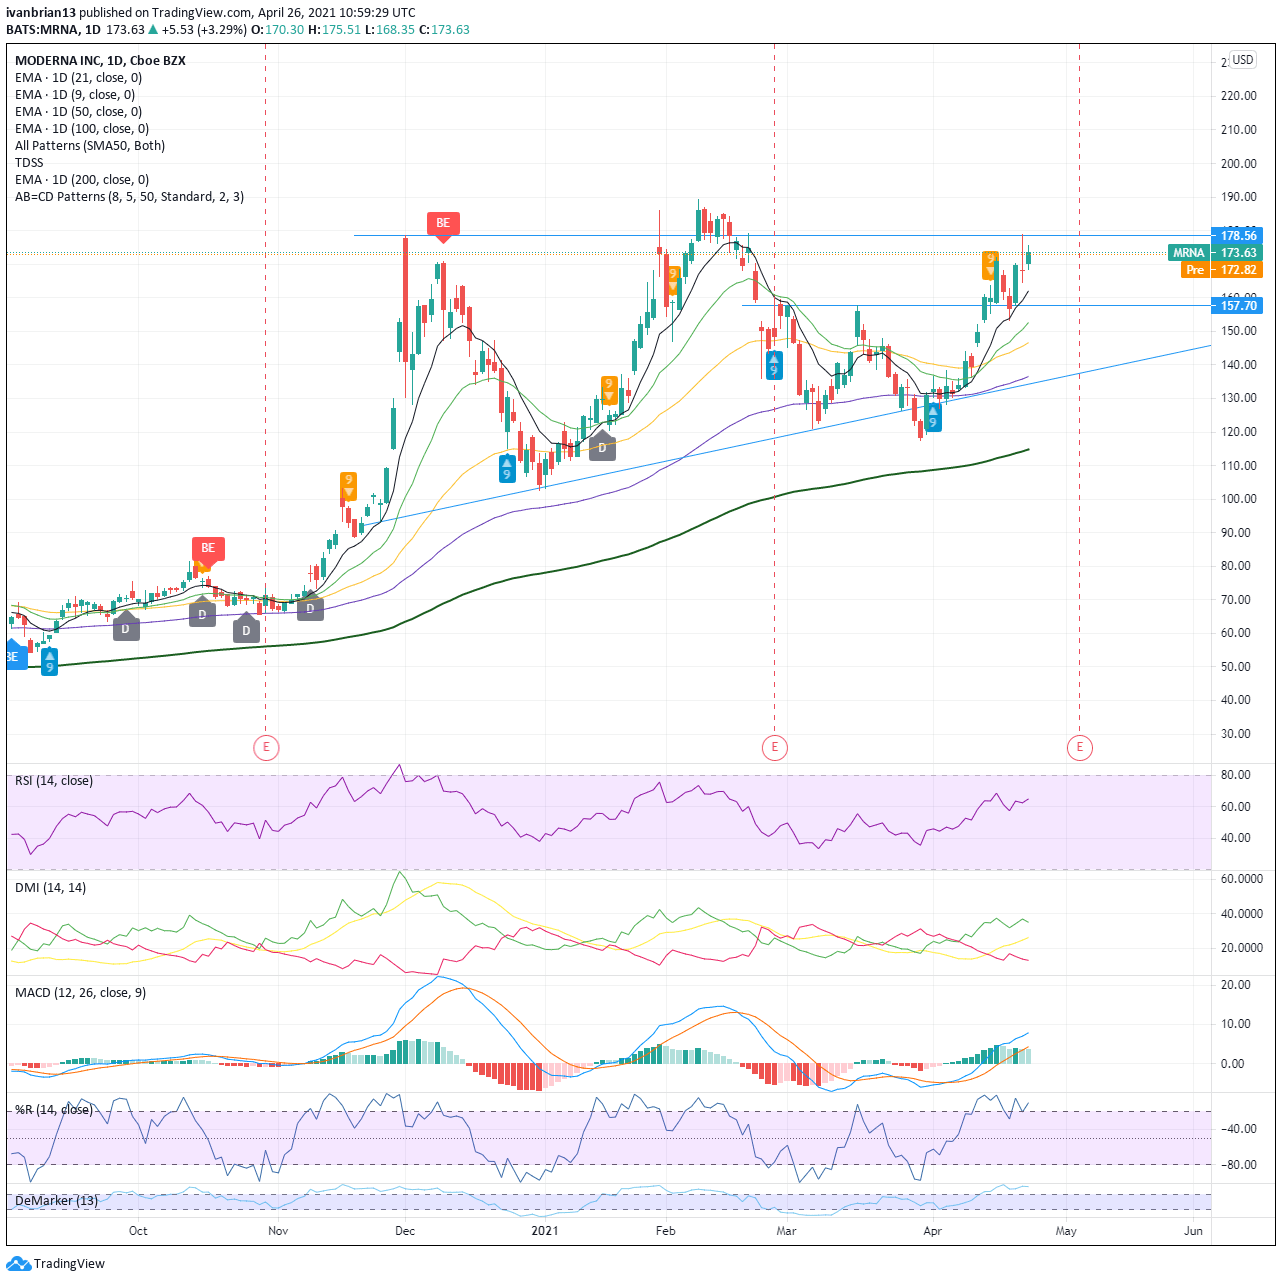
Technically, Moderna looks more likely to retest previous resistance at $178.50, the December 2020 high. This area is also the high from Thursday's $179. Moderna looks likely to benefit from increasing need as the global COVID situation still requires urgent attention and vaccinations, particularly in India. While the US, UK and other developed coutries are moving quickly ahead with vaccinations, the global situation is still deteriorating. Demand for COVID vaccines is likely to increase further as 2021 progresses.
Currently, Moderna is using its 9-day moving average as support. This 9-day acted as a nice resistance on the move down from highs in February and now acts as good support so we can clearly see how important it is. It acted as perfect support on the recent April 20 sell-off.
The indicators look bullish with Moving Average Convergence Divergence (MACD) crossing over to give a buy signal on April 7 and the Directional Movement Index (DMI) also showing a bullish trend is in place. The DMI is an indicator used to determine trend strength by comparing high and low prices. It has a +DMI line (green) to show rising prices and a -DMI line (red) to show negative rising prices. When the +DME is above the -DMI then the trend in prices is bullish. When the -DMI is above the +DMI then prices are bearish. The ADX is an average of the price trend, and values above 25 signify a strong trend. Crossovers during a strong trend (i.e. ADX above 25) are powerful reversal signals.
MRNA looks ready to retest previous highs above $190 and from here will likely test the psychological $200 level. Any pullback can be used to enter long positions at the 9-day moving average. A break of the 21-day moving average should be used as a stop. $157.70 is key to the bullish trend at present.
At the time of writing, the author has no position in any stock mentioned in this article and no business relationship with any company mentioned. The author has not received compensation for writing this article, other than from FXStreet.
This article is for information purposes only. The author and FXStreet are not registered investment advisors and nothing in this article is intended to be investment advice. It is important to perform your own research before making any investment and take independent advice from a registered investment advisor.
FXStreet and the author do not provide personalized recommendations. The author makes no representations as to accuracy, completeness, or the suitability of this information. FXStreet and the author will not be liable for any errors, omissions or any losses, injuries or damages arising from this information and its display or use. The author will not be held responsible for information that is found at the end of links posted on this page.
Errors and omissions excepted.
Premium
You have reached your limit of 3 free articles for this month.
Start your subscription and get access to all our original articles.
Author

Ivan Brian
FXStreet
Ivan Brian started his career with AIB Bank in corporate finance and then worked for seven years at Baxter. He started as a macro analyst before becoming Head of Research and then CFO.


