|

Microsoft higher high sequence suggested buying on dips

In this technical blog, we will look at the past performance of the 1-hour Elliott Wave Charts of Microsoft ticker symbol: MSFT. We presented to members at the elliottwave-forecast . In which, the rally from the 06 January 2023 low unfolded as an impulse structure & showed a higher high sequence favoring more upside to take place. Therefore, we advised members not to sell the stock & buy the dips in 3, 7, or 11 swings at the blue box areas. We will explain the structure & forecast below:

Microsoft 1-hour Elliott Wave chart from 2/06/2023

Chart

Here’s the 1hr Elliott wave chart from the 2/06/2023 Midday update. In which, the short-term cycle from the 1/31/2023 low ended in wave (iii) at $265.15 high. Down from there, the stock made a short-term pullback in wave (iv) to correct that cycle. The internals of that pullback unfolded as Elliott wave zigzag structure where lesser degree wave a ended at $258.06 low. Wave b bounce ended at $264.60 high. And wave c managed to reach the blue box area at $257.41- $252.95 equal legs area. From there, buyers were expected to appear looking for the next leg higher or for a 3 wave bounce minimum.

Microsoft latest 1-hour Elliott Wave chart from 2/08/2022

Chart

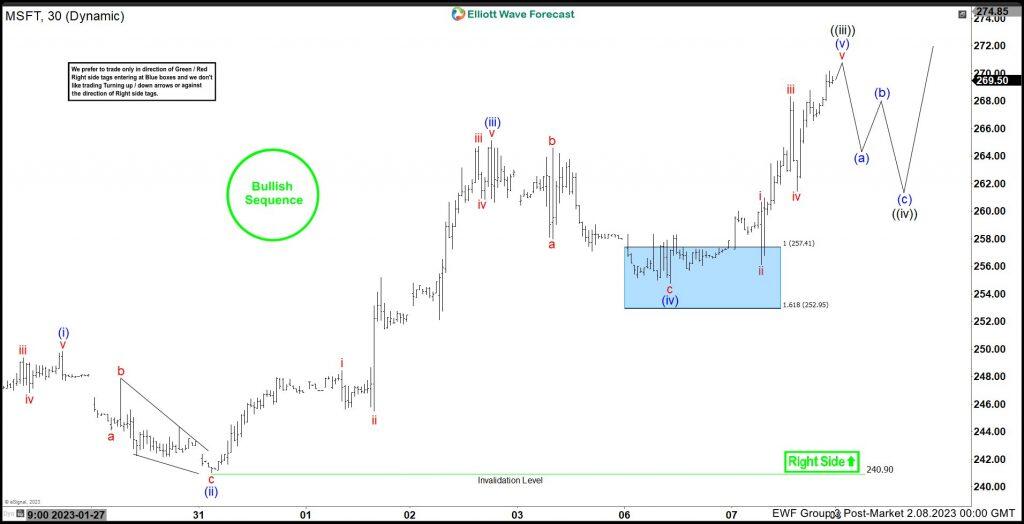
Above is the Latest 1hr Elliott wave Chart from the 2/08/2023 Post-market update. We can see the stock is showing a strong reaction higher right after ending the zigzag correction within the blue box area. This allowed members to create a risk-free position shortly after taking the long position at the blue box area. It already made a new high above $265.15 high confirming the next leg higher. Now reaching the $267.60- $271.53 area, which is the minimum extension target for wave (v) to end wave ((iii)). Before entering into another pullback again in wave ((iv)).

Author

Elliott Wave Forecast Team

Elliott Wave Forecast Team

ElliottWave-Forecast.com

More from Elliott Wave Forecast Team
Share:

Markets move fast. We move first.

Orange Juice Newsletter brings you expert driven insights - not headlines. Every day on your inbox.

By subscribing you agree to our Terms and conditions.

Editor's Picks

EUR/USD could test 1.1750 amid strengthening bullish bias

EUR/USD remains flat after two days of small losses, trading around 1.1740 during the Asian hours on Thursday. On the daily chart, technical analysis indicates a strengthening of a bullish bias, as the pair continues to trade within an ascending channel pattern.

GBP/USD consolidates above mid-1.3300s as traders await BoE and US CPI report

The GBP/USD pair struggles to capitalize on the overnight bounce from the 1.3310 area, or a one-week low, and oscillates in a narrow band during the Asian session on Thursday. Spot prices currently trade around the 1.3370 region, down less than 0.10% for the day, as traders opt to wait on the sidelines ahead of the key central bank event risk and US consumer inflation data.

Gold awaits weekly trading range breakout ahead of US CPI report

Gold struggles to capitalize on the previous day's move higher back closer to the $4,350 level and trades with a mild negative bias during the Asian session on Thursday. The downtick could be attributed to some profit-taking amid a US Dollar uptick, though it is likely to remain cushioned on the back of a supportive fundamental backdrop. 

Dogecoin breaks key support amid declining investor confidence

Dogecoin trades in the red on Thursday, following a 4% decline on the previous day. The DOGE supply in profit declines as large wallet investors trim their portfolios. Derivatives data shows a surge in bearish positions amid declining retail interest.

Monetary policy: Three central banks, three decisions, the same caution

While the Fed eased its monetary policy on 10 December for the third consecutive FOMC meeting, without making any guarantees about future action, the BoE, the ECB and the BoJ are holding their respective meetings this week. 

Dogecoin Price Forecast: DOGE breaks key support amid declining investor confidence

Dogecoin (DOGE) trades in the red on Thursday, following a 4% decline on the previous day. The DOGE supply in profit declines as large wallet investors trim their portfolios. Derivatives data shows a surge in bearish positions amid declining retail interest.