ITC LTD Elliott Wave technical analysis [Video]
![ITC LTD Elliott Wave technical analysis [Video]](https://editorial.fxstreet.com/images/Markets/Equities/Industries/Hardware/hardware-network-637435380515966806.jpg)
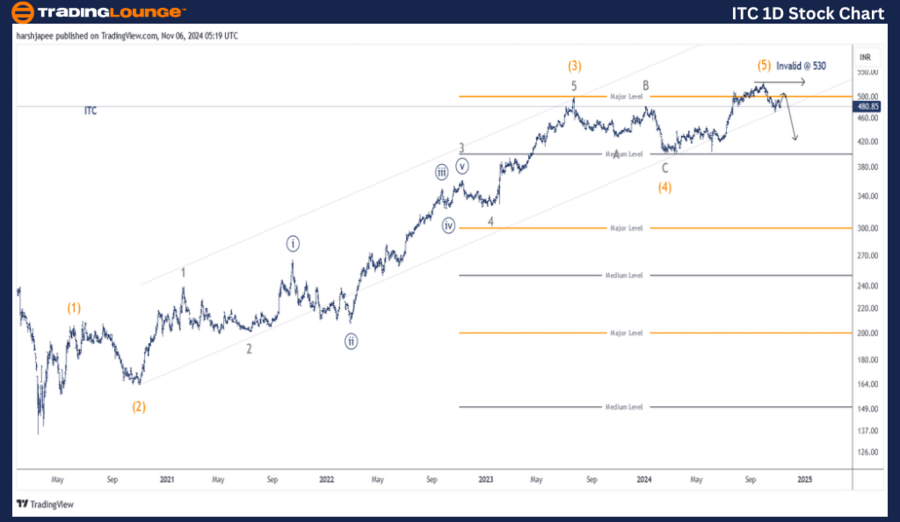
ITC LTD – ITC (1D chart) Elliott Wave technical analysis
Function: Counter Trend (Minor degree, Grey).
Mode: Corrective.
Structure: Impulse within larger degree corrective wave.
Position: Lower degree impulse might be complete. Not labelled yet.
Details: We have proposed a potential change in the trend as price action confirms a break below 480 last week. A lower (Minute) degree impulse wave might be complete but not labelled yet. Will highlight an alternate count when price action is relevant.
Invalidation point: 530.
ITC Daily Chart Technical Analysis and potential Elliott Wave Counts:
ITC daily chart is indicating a potential termination of Intermediate Wave (5) Orange at 530 high. If correct, a corrective wave should be now underway with prices dropping through 400 levels in the past few trading sessions. Alternatively, Minor Wave 4 of (5) is now complete around 470 mark.
The stock had dropped through 135 lows around March 2020, which is followed by a religious rally through 530 high completing an impulse at Intermediate degree. Please also note that Minor Wave 3 of Intermediate Wave (3) was extended.
Intermediate Wave (4) terminated around 400 mark, followed by a rally through 530 to terminate Intermediate Wave (5). If the above holds well, ITC should be well underway lower to produce a larger degree corrective drop.
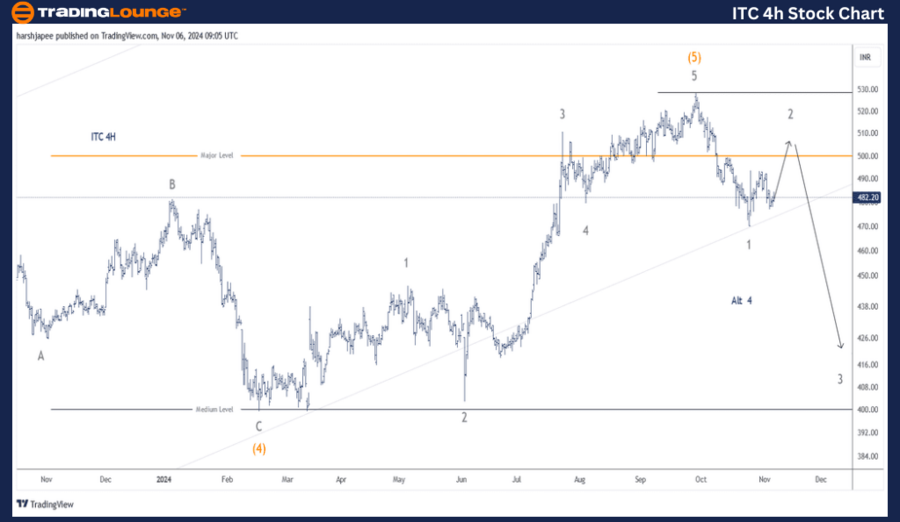
ITC LTD – ITC (4H chart) Elliott Wave technical analysis
Function: Counter Trend (Minor degree, Grey).
Mode: Corrective.
Structure: Impulse within larger degree corrective wave.
Position: Lower degree impulse might be complete.
Details: We have proposed a potential change in the trend as price action confirms a break below 480 last week. A lower (Minute) degree impulse wave might be complete but not labelled yet. Alternatively, the high registered at 530 could be Minor Wave 3 followed by Wave 4 around 470. If the alternate turns true, the stock could witness another high above 530 going forward.
Invalidation point: 530.
ITC 4H Chart Technical Analysis and potential Elliott Wave Counts:
ITC 4H chart reveals sub waves since Intermediate Wave (4) Orange termination around 400-05 mark. Intermediate Wave (5) could be sub divided into Minor Waves 1 through 5 to terminate around 530 level. Alternatively, Minor Wave 4 is no complete around 470 and prices could produce another rally above 530 mark.
Conclusion:
ITC might have terminated Intermediate Wave (5) Orange around 530 mark and a larger degree corrective wave is now underway.
Elliott Wave analyst: Harsh Japee.
ITC LTD – ITC Elliott Wave technical analysis [Video]
Author

Peter Mathers
TradingLounge
Peter Mathers started actively trading in 1982. He began his career at Hoei and Shoin, a Japanese futures trading company.


