Is this the week that Nvidia becomes the first $5 trillion company?
- NVDA trades up to $203 on Tuesday, just below $5 trillion market cap.
- Nvidia will become first $5 trillion company at approximately $205.36.
- Trump to meet with CEO Huang on Wednesday.
- Fed's expected interest rate cut on top of tech earnings could send NVDA up to $218.

Nvidia (NVDA) shot up above $200 per share on Tuesday afternoon, gaining more than 6% on the session. Nvidia's share price is just 2% below $205.36, where it becomes the first stock to achieve a $5 trillion market cap.
Generally positive earnings from other companies melded with a number of new Nvidia partnership announcements to give the world's largest company a boost. The leading semiconductor designer of the AI revolution inked a deal with Nokia to invest $1 billion in the Finnish telecom company. Then, US President Donald Trump said he planned on meeting with Nvidia CEO Jensen Huang during his current Asia trip on Wednesday. Additionally, Huang plans to meet with officials from Hyundai and Samsung to discuss AI integrations.
The general market tenor hasn't hurt either. UnitedHealth Group (UNH), United Parcel Service (UPS), PayPal (PYPL) and Celestica (CLS) all saw their shares pump on Tuesday following earnings results.
On Monday, Nvidia announced that it was partnering with Deutsche Telekom to develop a 1.2 billion Euro AI data center in Germany. Foxconn announced this week that it will spend $1.37 billion on an AI compute cluster and a supercomputing center in Taiwan to be completed in late 2026.
Nvidia stock chart
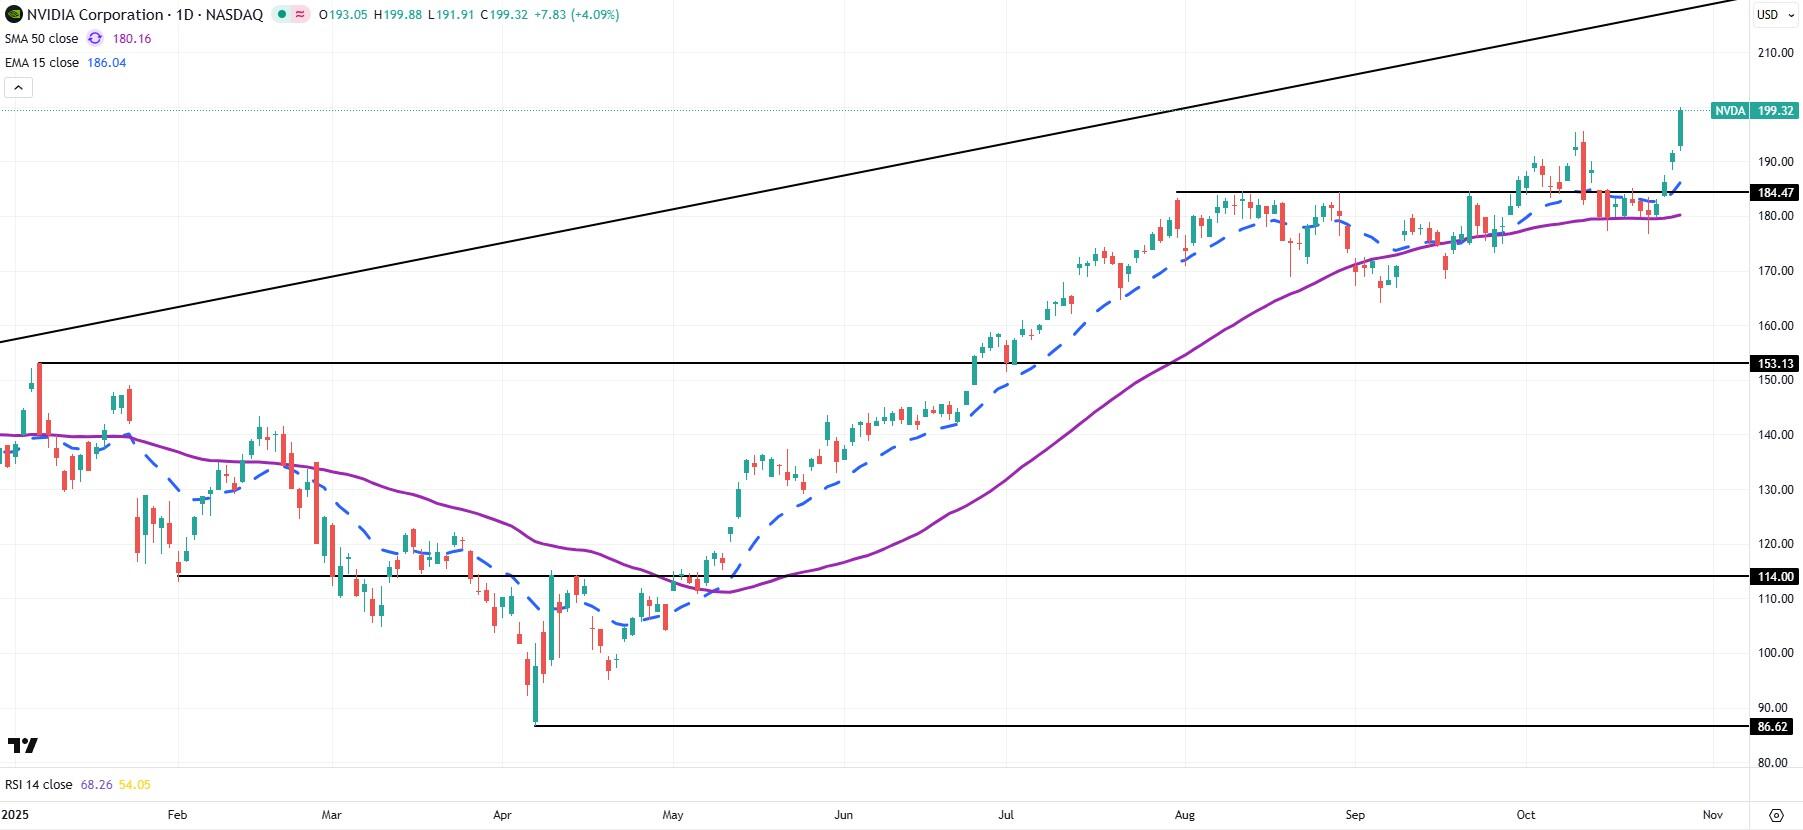
Nvidia stock's long rally is not over, folks. The past three sessions have seen NVDA triumph above the prior resistance at $184.47. After achieving the $5 trillion market, which traders are keenly aware of, bulls might push Nvidia shares up to the long-term trendline that began in the first half of 2023. That upper trendline puts a cap on NVDA gains near $216 to $218, depending on where it is drawn.
With the 50-day Simple Moving Average (SMA) now above $180, that price level now becomes a sturdy center of support. While many call this AI rally a bubble, it clearly isn't finished. In fact, with the Federal Reserve (Fed) geared up to cut interest rates on Wednesday, as well as Meta (META), Microsoft (MSFT) and Alphabet (GOOGL) releasing earnings afterhours, expect this week to run hot.
NVDA daily stock chart
Author
Clay Webster
FXStreet
Clay Webster grew up in the US outside Buffalo, New York and Lancaster, Pennsylvania. He began investing after college following the 2008 financial crisis.