IBEX 35 (Spain) Elliott Wave technical analysis [Video]
![IBEX 35 (Spain) Elliott Wave technical analysis [Video]](https://editorial.fxstreet.com/images/Markets/Equities/financial-figures-7116094_XtraLarge.jpg)
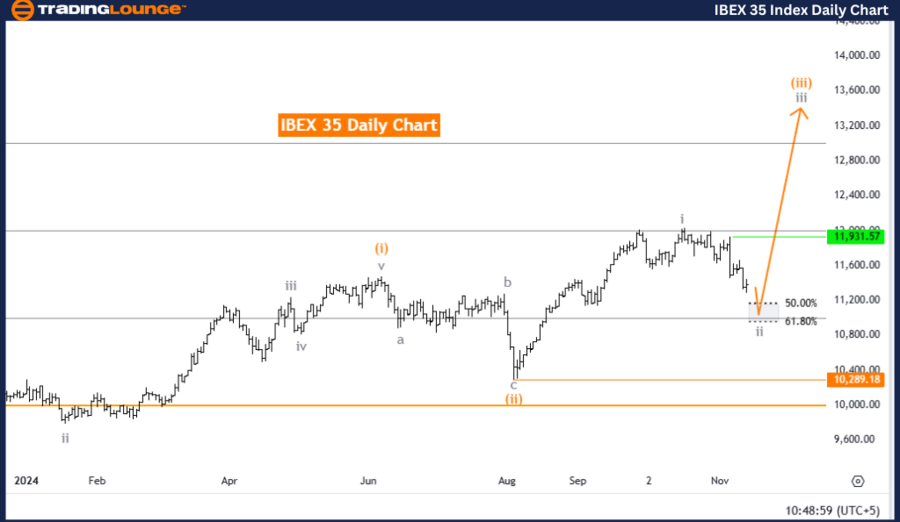
IBEX 35 Elliott Wave Analysis - Trading Lounge Day Chart.
IBEX 35 (Spain) Daily Chart Analysis.
IBEX 35 Elliott Wave technical analysis
-
Function: Counter Trend.
-
Mode: Corrective.
-
Structure: Gray Wave 2.
-
Position: Orange Wave 3.
-
Direction (next higher degrees): Gray Wave 3.
-
Details: Gray wave 1 appears completed; gray wave 2 within orange wave 3 is active.
-
Wave cancellation invalidation level: 10,289.18.
Analysis overview
The IBEX 35 Elliott Wave analysis on the daily chart by Trading Lounge indicates a counter-trend movement within the Spanish stock index, which is currently in a corrective mode. The analysis highlights that gray wave 2 is developing within the broader orange wave 3, signaling a corrective phase. This stage suggests a pause or temporary reversal in the broader upward trend, reflecting a shift in momentum.
Wave details
-
Gray wave 1 appears complete, paving the way for gray wave 2 to progress as part of the larger wave structure.
-
Within the Elliott Wave framework, wave 2 typically represents a counter-trend retracement, characterized by periods of consolidation or price correction.
-
The ongoing corrective phase within orange wave 3 suggests the index may experience a temporary dip before resuming an upward trajectory in subsequent phases, particularly within the higher-degree gray wave 3.
Key level: Invalidation threshold.
A crucial invalidation level is established at 10,289.18:
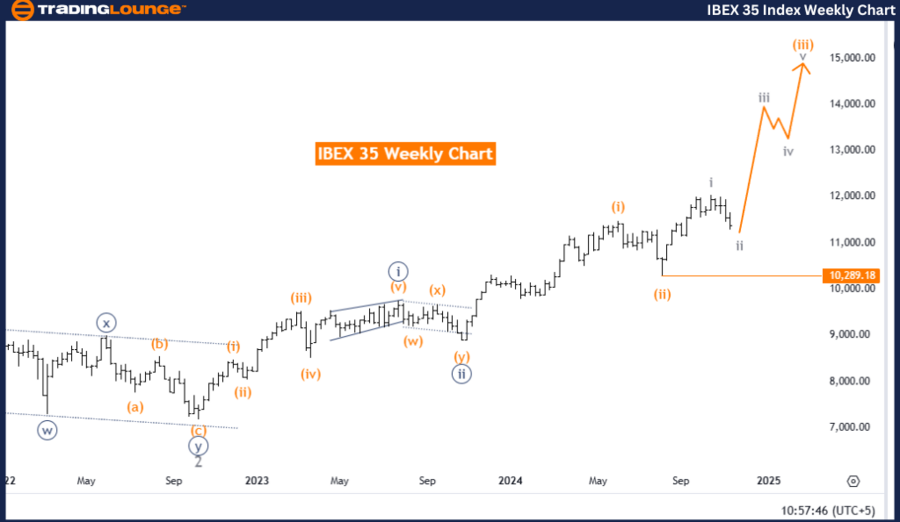
IBEX 35 Elliott Wave Analysis - Trading Lounge Weekly Chart.
IBEX 35 (Spain) Weekly Chart Analysis.
IBEX 35 Elliott Wave technical analysis
-
Function: Bullish Trend.
-
Mode: Impulsive.
-
Structure: Orange Wave 3.
-
Position: Navy Blue Wave 3.
-
Direction (next higher degrees): Continuation of Orange Wave 3.
-
Details: Orange wave 2 appears complete; orange wave 3 within navy blue wave 3 is active.
-
Wave cancellation invalidation level: 10,289.18.
Analysis overview
The IBEX 35 Elliott Wave analysis on the weekly chart by Trading Lounge highlights a bullish trend for the Spanish stock index, supported by an impulsive wave structure. Currently, orange wave 3 is advancing as part of the broader navy blue wave 3, suggesting sustained upward momentum in the IBEX 35 as the wave structure unfolds.
Wave details
-
The completion of orange wave 2 has enabled the continuation of orange wave 3, which is typically one of the most significant and powerful phases in the Elliott Wave sequence.
-
This phase often signals notable price increases, as wave 3 carries the strongest movements in the direction of the trend.
-
Positioned within navy blue wave 3, the ongoing orange wave 3 further reinforces the positive outlook for IBEX 35, indicating a continuation of bullish momentum.
Key level: Invalidation threshold.
The invalidation level is set at 10,289.18:
-
If the IBEX 35 index falls to or below this level, the current wave structure will be invalidated.
-
A drop below this threshold may signal a pause or reversal in the upward trend, necessitating a reassessment of the Elliott Wave structure and overall trend direction.
This threshold is critical for confirming the continuation of the bullish trend and identifying any potential disruptions to the wave structure.
Summary and recommendations
The weekly analysis presents a bullish outlook for the IBEX 35, with orange wave 3 actively progressing within navy blue wave 3, signaling further upward momentum. Traders should monitor the index closely in relation to the invalidation level at 10,289.18, as any movement below this point could challenge the current bullish wave structure. This level serves as a crucial checkpoint to validate the strength and continuity of the ongoing trend.
Technical analyst: Malik Awais.
IBEX 35 Elliott Wave technical analysis [Video]
Author

Peter Mathers
TradingLounge
Peter Mathers started actively trading in 1982. He began his career at Hoei and Shoin, a Japanese futures trading company.


