|

Home Depot (HD) is correcting the cycle since the company’s inception

Home Depot (HD), is an American multinational home improvement retail corporation that sells tools, construction products, appliances, and services, including fuel and transportation rentals. Home Depot is the largest home improvement retailer in the United States.

The shares of the Home Depot HD company have entered a very interesting stage. After reaching all-time highs in December 2021, the price fell considerably. According to the Elliott Wave Principle, the stock price should continue to fall. The structure that is developing appears to be a zigzag correction, and if so, it still has a lot of things to say. (If you want to learn more about Elliott Wave Theory, please follow these links: Elliott Wave Education and Elliott Wave Theory).

Home Depot HD monthly chart April 2023

HD

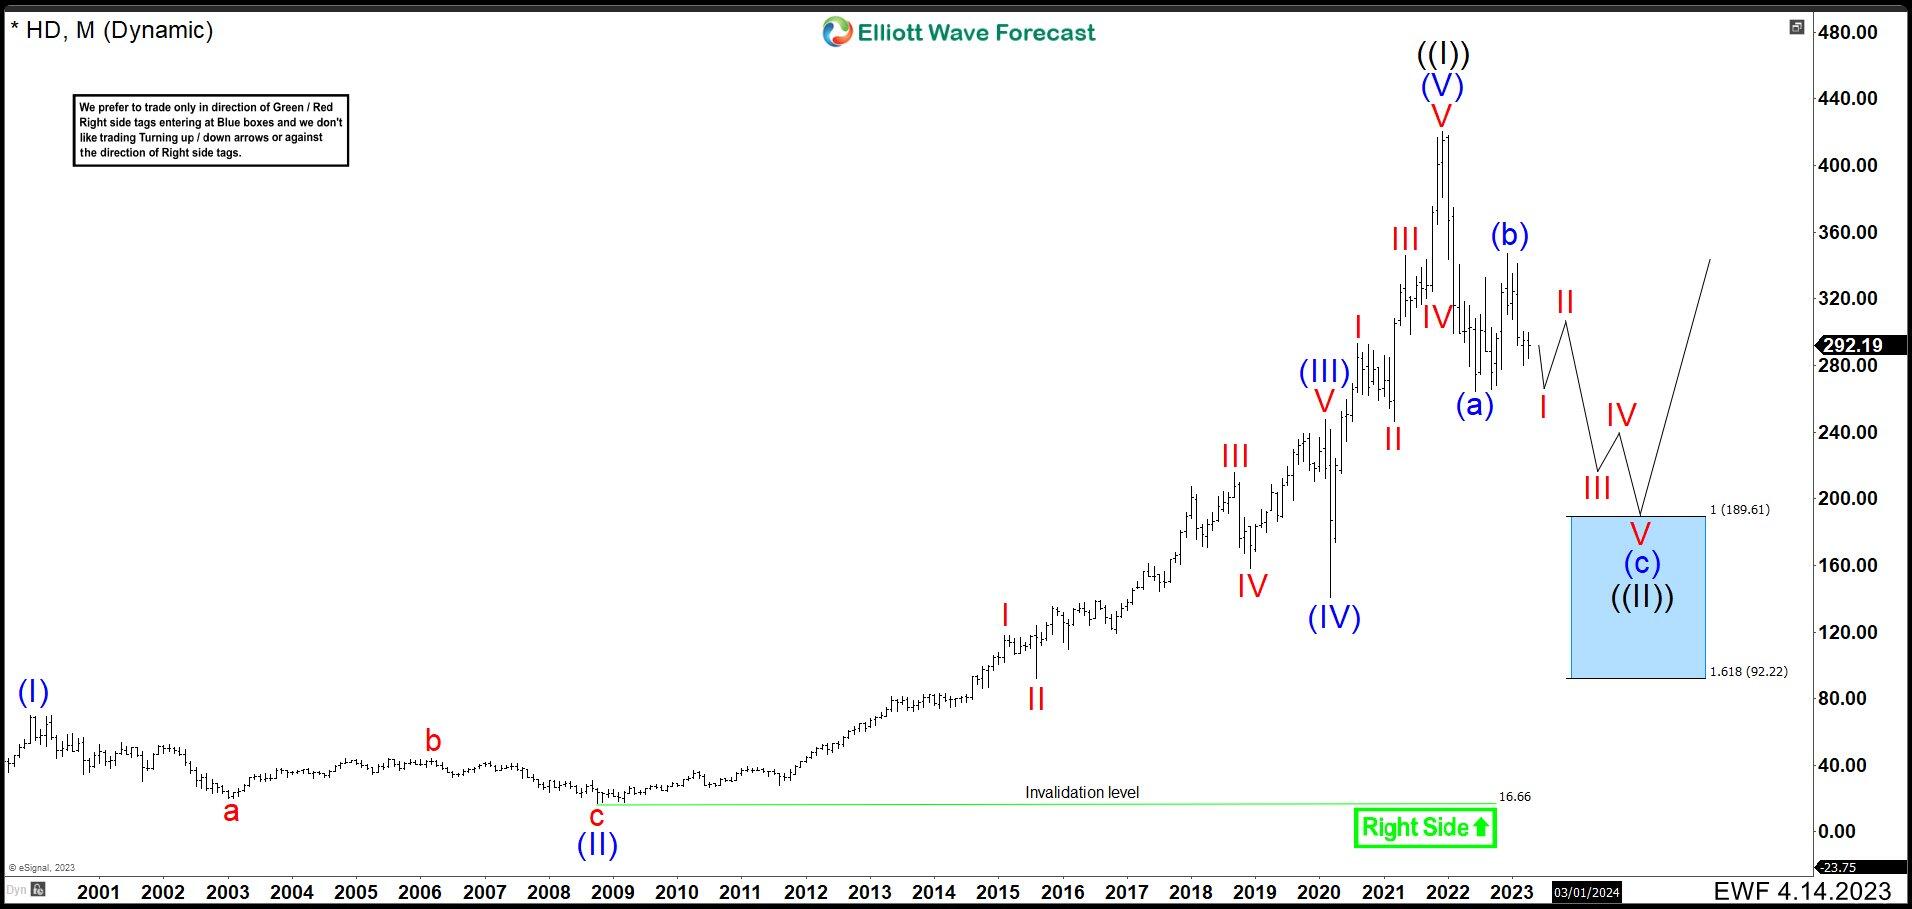
As we can see above on the monthly chart, HD finished its first grand cycle since the company’s inception in late 1999, reaching $70.08. We called this movement the wave (I). At this price, it entered in a corrective phase that ended in 2008 recession at $16.66. We labeled it as wave (II). Since then, the price kept a strong bullish trend, rising as high as $247.70 to complete wave (III). Then, we clearly see the wave (IV) at the beginning of the COVID19 pandemic, in 2020, when the price fell to $139.84. From here, it had again a strong rebound creating a new impulse, being wave IV as a running flat, thus wave V is the shortest of the impulse. This completed wave (V) at $420.79 and wave ((I)) of the grand super cycle in December 2021.

The correction started in December 2021

Since 2021 high, the price of HD has remained bearish and to complete the corrective structure it should continue to decline further. This is because to complete a corrective structure is needed a minimum of 3 waves, where the third wave must break the end of the first wave at least marginally. This suggests further drops in the price of HD which should ideally hit the blue box, this is in the area of $189.61 – $92.22. If we see 5 waves down from wave (b) in this area, this is a good opportunity to look for longer-term buys. However, it is not 100% certain that HD will go as low as $189.61. If 5 waves marginally breaks the low of wave (a) at $263.85, wave (c) of ((II)) and wave ((II)) could be over to continue a new rally.

Author

Elliott Wave Forecast Team

Elliott Wave Forecast Team

ElliottWave-Forecast.com

More from Elliott Wave Forecast Team
Share:

Markets move fast. We move first.

Orange Juice Newsletter brings you expert driven insights - not headlines. Every day on your inbox.

By subscribing you agree to our Terms and conditions.

Editor's Picks

EUR/USD steadies near 1.1750 ahead of final Eurozone CPI amid fading USD recovery

The EUR/USD pair steadies around the 1.1750 area during the Asian session on Wednesday, and for now, seems to have stalled the previous day's sharp retracement slide from the highest level since September 24. Meanwhile, the fundamental backdrop remains tilted in favor of bullish traders and suggests that the path of least resistance for spot prices remains to the upside.

GBP/USD gains ground above 1.3400 on UK PMI optimism

The GBP/USD pair gains momentum to around 1.3425 during the early Asian session on Wednesday. The Pound Sterling edges higher against the Greenback on the upbeat UK preliminary S&P Global Purchasing Managers' Index data. Traders will take more cues from the Fedspeak later on Wednesday. 

Gold advances to near seven-week highs amid US labor market cooling

Gold price extends its upside to near seven-week highs above $4,300 during the Asian trading hours on Wednesday. The precious metal gains momentum as the US labor market remains relatively resilient but shows signs of slowing. The mixed US employment report for November reinforces bets of further rate cuts by the US Federal Reserve and weighs on the US Dollar.

Top Crypto Gainers: SPX6900, Pi Network, Filecoin – Sudden rebound lifts bullish spirit

SPX6900, Pi Network, and Filecoin emerge as top gainers in the last 24 hours as the broader cryptocurrency market remains under bearish pressure. The sudden rebound in SPX, PI, and FIL suggests a possible rally, as the Moving Average Convergence Divergence indicator on the 4-hour chart flashes a buy signal. 

Ukraine-Russia in the spotlight once again

Since the start of the week, gold’s price has moved lower, but has yet to erase the gains made last week. In today’s report we intend to focus on the newest round of peace talks between Russia and Ukraine, whilst noting the release of the US Employment data later on day and end our report with an update in regards to the tensions brewing in Venezuela.

BNB Price Forecast: BNB slips below $855 as bearish on-chain signals and momentum indicators turn negative

BNB, formerly known as Binance Coin, continues to trade down around $855 at the time of writing on Tuesday, after a slight decline the previous day. Bearish sentiment further strengthens as BNB’s on-chain and derivatives data show rising retail activity.