HCL Technologies Indian Stocks Elliott Wave technical analysis [Video]
![HCL Technologies Indian Stocks Elliott Wave technical analysis [Video]](https://editorial.fxstreet.com/images/Markets/Equities/Industries/CapitalGoods/elevating-boxes-warehouse_XtraLarge.jpg)
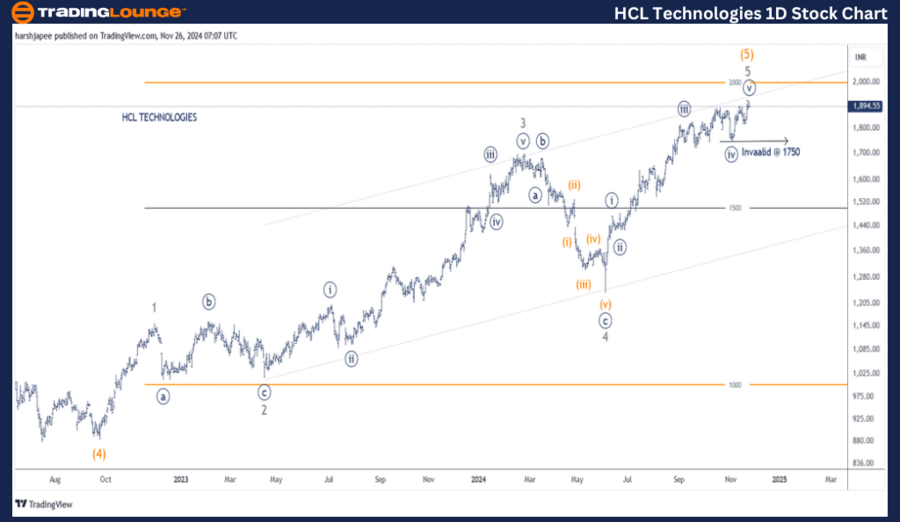
HCL Technologies – HCLTECH (1D chart) Elliott Wave technical analysis
Function: Larger Degree Trend Higher (Intermediate degree, orange).
Mode: Motive.
Structure: Impulse.
Position: Minute Wave ((v)) Navy.
Details: Minute Wave ((v)) is still progressing higher within Minor Wave 5 of Intermediate Wave (5) Orange against 1750.
Invalidation point: 1750.
HCL TECHNOLOGIES Daily Chart Technical Analysis and potential Elliott Wave Counts:
HCL TECHNOLOGIES daily chart is indicating a potential end approaching to the larger degree uptrend, which has reached 1930 mark. The Intermediate Wave (5) Orange is either complete or near to complete going forward. A break below 1750 could be the first sign of a turn.
Earlier, the stock dropped through 885 lows, marked as Intermediate Wave (4), in September 2022. It looks in-line with most global tech stocks bottoming around the same period. Since then a clear five wave rally can be seen unfolding through 1930 high.
Minor Wave 3 was an extension, whereas Minor Wave 4 unfolded as a flat (3-3-5) structure. If the above proposed structure holds well, the stock should be preparing to turn lower soon. Minute Wave ((iv)) around 1750 remains key for bulls to stay in control.
HCL Technologies – HCLTECH (4H chart) Elliott Wave technical analysis
Function: Larger Degree Trend Higher (Intermediate degree, orange).
Mode: Motive.
Structure: Impulse.
Position: Minute Wave ((v)) Navy.
Details: Minute Wave ((v)) is still progressing higher within Minor Wave 5 of Intermediate Wave (5) Orange against 1750.
Invalidation point: 1750.
HCL TECHNOLOGIES 4H Chart Technical Analysis and potential Elliott Wave Counts:
HCL TECHNOLOGIES 4H chart is highlighting the sub waves after Minor Wave 3 completed around 1695 high in February 2024. Minor Wave 4 unfolded as a Flat (3-3-5) structure terminating around 1240 mark. Since then Minor Wave 5 has unfolded as an impulse pushing through 1930 mark as Minute Wave ((v)) is still unfolding.
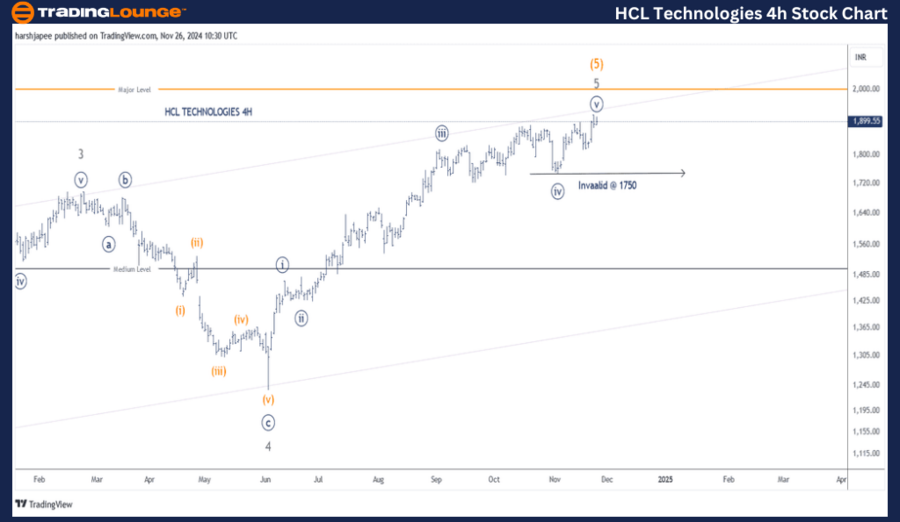
Conclusion:
HCL TECHNOLOGIES is progressing higher within Minute Wave ((v)) of Minor Wave 5 against 1750 lows.
Elliott Wave analyst: Harsh Japee.
HCL Technologies – HCLTECH (1D Chart) Elliott Wave Technical Analysis
Author

Peter Mathers
TradingLounge
Peter Mathers started actively trading in 1982. He began his career at Hoei and Shoin, a Japanese futures trading company.


