GX Uranium ETF Elliott Wave technical analysis [Video]
![GX Uranium ETF Elliott Wave technical analysis [Video]](https://editorial.fxstreet.com/images/Markets/Equities/Industries/EnergyStocks/electric-power-637435385712017394_XtraLarge.jpg)
GX URA Elliott Wave analysis
The GX URA ETF, or Global X Uranium ETF, is designed to track the performance of companies within the uranium industry. This ETF provides investors with a diversified portfolio that includes firms involved in uranium mining, exploration, and production globally. As nuclear power gains recognition as a cleaner energy alternative, the demand for uranium is expected to rise, making the GX URA ETF an appealing option for investors aiming to benefit from the sector's growth.
GX URA ETF Elliott Wave analysis
The GX URA ETF has resumed its downward trajectory, continuing the sell-off that began from its peak in May 2024. The recent decline suggests the formation of a bearish impulse wave structure, indicating that further downside movement is likely in the coming weeks.
Daily chart analysis
On the daily chart, the bullish corrective cycle that began in March 2020 concluded on May 21, 2024. During this cycle, the supercycle waves (a)-(b)-(c) unfolded, with wave (a) completing as an impulse wave in November 2021. This was followed by a wave (b) pullback, which ended as a double zigzag in July 2022 at 17.70. From the July 2022 low, a bullish impulse wave commenced, culminating at the May 2024 peak.
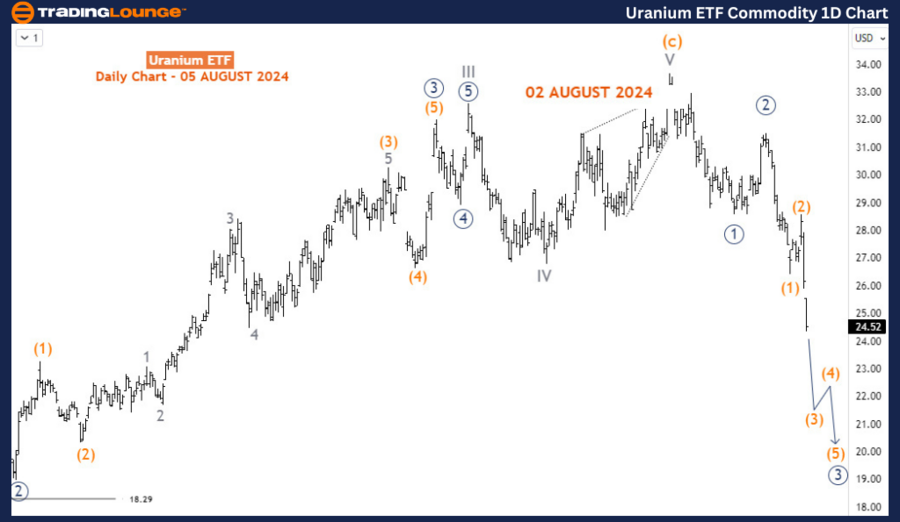
From this peak, we are likely to witness either a full bearish impulse wave sequence (1-2-3-4-5) or an A-B-C corrective decline of the cycle degree. The price is currently in wave (3) of 3 (circled) of either a or I, suggesting that wave (3) could extend lower toward the 21.58-20.39 range in the coming weeks.
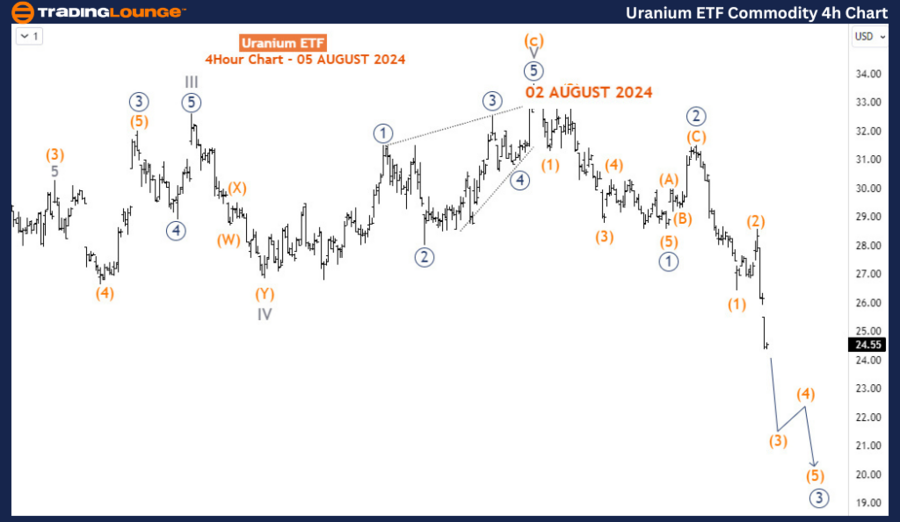
H4 chart analysis
The H4 chart aligns with the daily chart's outlook, reinforcing the expectation that wave (3) will continue to push lower. Sellers are in control of this ETF, and the bearish momentum is likely to persist, driving prices further down.
Conclusion
In summary, the GX URA ETF is amid a significant sell-off, driven by a developing bearish impulse wave structure. With the potential for wave (3) to extend lower, traders should expect continued downward pressure on this ETF. The outlook remains bearish, and selling opportunities may arise as the market progresses toward key support levels
Technical analyst: Sanmi Adeagbo.
GX URA Elliott Wave analysis [Video]
Author

Peter Mathers
TradingLounge
Peter Mathers started actively trading in 1982. He began his career at Hoei and Shoin, a Japanese futures trading company.


