|

Gold Technical Analysis: Bears await a break below an important horizontal support

   •  The commodity extended last week's rejection slide from $1235 horizontal resistance and remains within striking distance of an important horizontal support.

   •  A convincing break below the mentioned horizontal support would confirm a bearish double-top chart pattern on the 1-hourly chart and pave the way for the additional near-term downfall. 

   •  Technical indicators on the said chart hold in bearish territory and hence, a follow-through weakness, possibly back towards YTD lows, remains a distinct possibility.
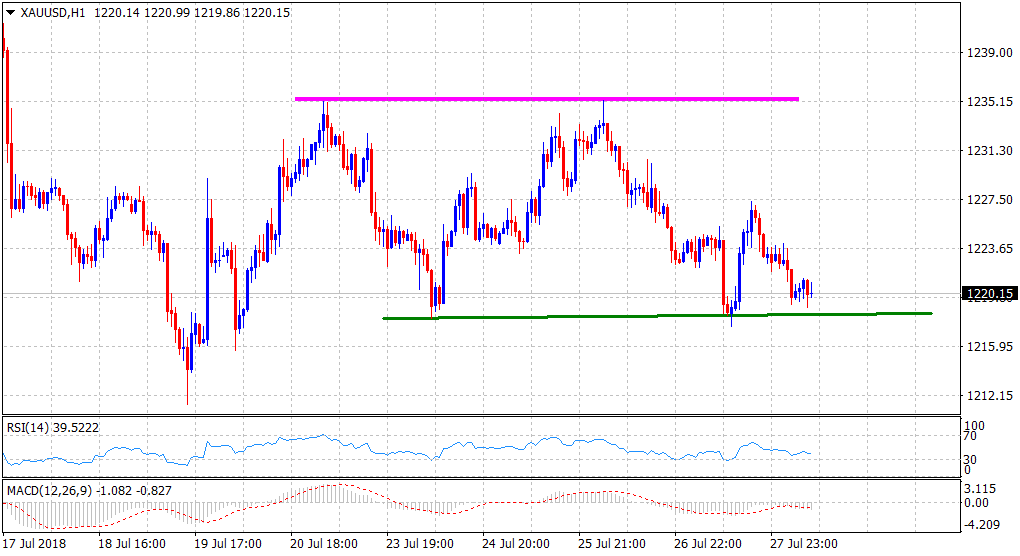
Gold 1-hourly chart

Spot rate: $1220
Daily High: $1224
Trend: Bearish

Resistance
R1: $1224 (current day swing high)
R2: $1231 (horizontal zone)
R3: $1235 (double-top supply zone)

Support
S1: $1217-18 (Friday's swing low)
S2: $1212 (YTD low set on July 19)
S3: $1205 (July 2017 swing low)
 

Author

Haresh Menghani

Haresh Menghani is a detail-oriented professional with 10+ years of extensive experience in analysing the global financial markets.

More from Haresh Menghani
Share:

Editor's Picks

EUR/USD trims gains, hovers around 1.1900 post-US data

EUR/USD trades slightly on the back foot around the 1.1900 region in a context dominated by the resurgence of some buying interest around the US Dollar on turnaround Tuesday. Looking at the US docket, Retail Sales disappointed expectations in December, while the ADP 4-Week Average came in at 6.5K.

GBP/USD comes under pressure near 1.3680

The better tone in the Greenback hurts the risk-linked complex on Tuesday, prompting GBP/USD to set aside two consecutive days of gains and trade slightly on the defensive below the 1.3700 mark. Investors, in the meantime, keep their attention on key UK data due later in the week.

Gold loses some traction, still above $5,000

Gold faces some selling pressure on Tuesday, surrendering part of its recent two-day advance although managing to keep the trade above the $5,000 mark per troy ounce. The daily pullback in the precious metal comes in response to the modest rebound in the US Dollar, while declining US Treasury yields across the curve seem to limit the downside.

XRP holds $1.40 amid ETF inflows and stable derivatives market

Ripple trades under pressure, with immediate support at $1.40 holding at the time of writing on Tuesday. A recovery attempt from last week’s sell-off to $1.12 stalled at $1.54 on Friday, leading to limited price action between the current support and the resistance.

Dollar drops and stocks rally: The week of reckoning for US economic data

Following a sizeable move lower in US technology Stocks last week, we have witnessed a meaningful recovery unfold. The USD Index is in a concerning position; the monthly price continues to hold the south channel support.

XRP holds $1.40 amid ETF inflows and stable derivatives market

Ripple trades under pressure, with immediate support at $1.40 holding at the time of writing on Tuesday. A recovery attempt from last week’s sell-off to $1.12 stalled at $1.54 on Friday, leading to limited price action between the current support and the resistance.