Gold technical analysis: 100-HMA triggers the U-turn towards $1421
- Oversold RSI, 100-HMA pull the Gold prices back towards immediate horizontal resistance.
- $1382 and 200-HMA should gain market attention during the fresh downpour.

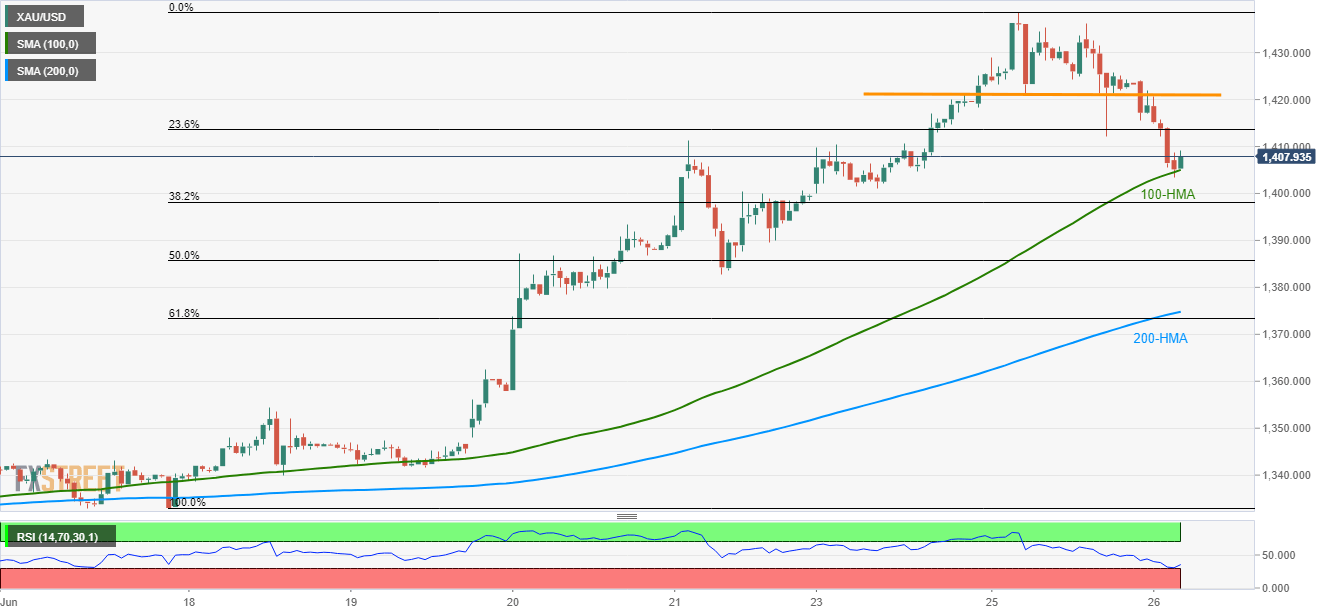
Gold is on a run towards near-term horizontal-resistance following its U-turn from the 100-hour moving average (HMA) ticks it up to $1407.80 ahead of the European open on Wednesday.
While multiple extremes marked during last two-days highlight $1421 as the key resistance, 23.6% Fibonacci retracement of the bullion’s rise since June 17, at $1413.56, may serve as the closest upside barrier.
During the precious-metal’s extended recovery beyond $1421, latest high around $1438.66 and the April 2013 top near $1488 can become bull’s favorites.
It is worth noting that the 14-bar relative strength index (RSI) recently bounced off the oversold territory.
Alternatively, a downside break of $1405 HMA support can take halt around Friday’s bottom surrounding $1382 ahead of visiting an area comprising 200-HMA and 61.8% Fibonacci retracement near $1373/75.
If at all the quote keep trading southwards beneath $1373, $1362 and $1348 might lure the sellers.
Gold hourly chart
Trend: Bullish
Author

Anil Panchal
FXStreet
Anil Panchal has nearly 15 years of experience in tracking financial markets. With a keen interest in macroeconomics, Anil aptly tracks global news/updates and stays well-informed about the global financial moves and their implications.


