|

Gold Technical Analysis: 100-day EMA keeps sellers hopeful

  • Gold prices seesaw near October low.
  • Oversold RSI conditions, July month high question further declines.
  • October 11 low, 21-day EMA exert downside pressure.

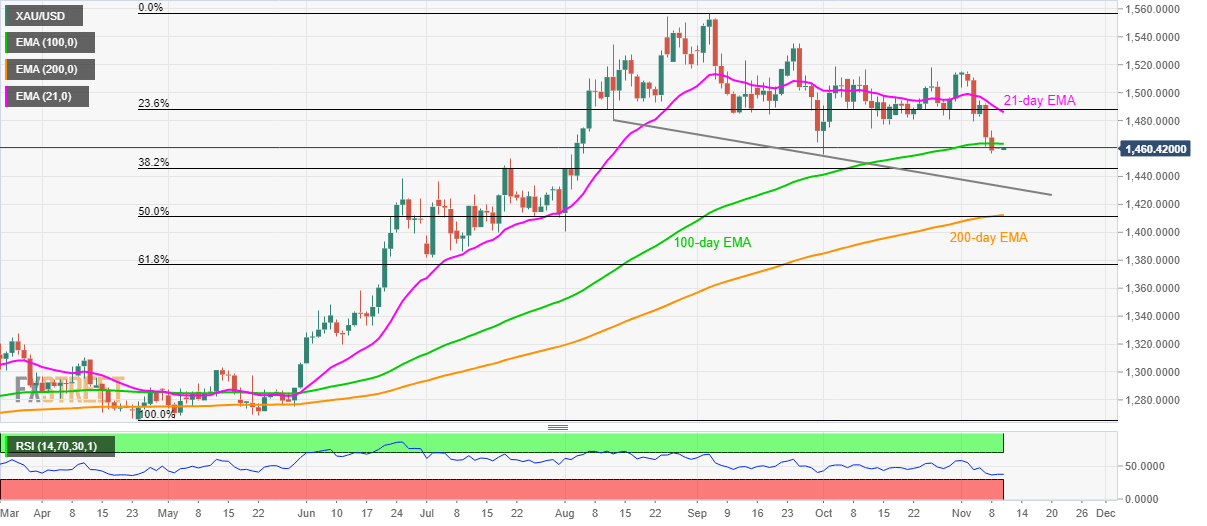
Although Gold prices stop further declines below October low, a sustained trading below 100-day EMA for the first time since late-May keep sellers hopeful as the metal trade around $1,460 during the Asian session on Monday.

July month high close to $1,452.50 seems to be the immediate support ahead of 38.2% Fibonacci retracement of April-September upside, at $1,445.

Should the quote continue trading southwards past-$1,445, a descending trend line since mid-August, around $1,433 and $1,412/11 area including 200-day Exponential Moving Average (EMA) and 50% Fibonacci retracement will be on bears’ radar.

Though, nearly oversold conditions of 14-bar Relative Strength Index (RSI) can pierce a 100-day EMA level of 1,464, which in turn could challenge October 11 low around $1,474.

It should, however, be noted that 21-day EMA and 23.6% Fibonacci retracement close to $1,486/88 area could keep buyers in check after $1,474.

Gold daily chart

Trend: pullback expected

Additional important levels

Overview
Today last price1460.57
Today Daily Change1.96
Today Daily Change %0.13%
Today daily open1458.61
 
Trends
Daily SMA201491.66
Daily SMA501499.53
Daily SMA1001476.85
Daily SMA2001390.47
 
Levels
Previous Daily High1472.94
Previous Daily Low1456.43
Previous Weekly High1514.85
Previous Weekly Low1456.43
Previous Monthly High1519.04
Previous Monthly Low1455.5
Daily Fibonacci 38.2%1462.73
Daily Fibonacci 61.8%1466.63
Daily Pivot Point S11452.38
Daily Pivot Point S21446.15
Daily Pivot Point S31435.88
Daily Pivot Point R11468.89
Daily Pivot Point R21479.16
Daily Pivot Point R31485.39

Author

Anil Panchal

Anil Panchal

FXStreet

Anil Panchal has nearly 15 years of experience in tracking financial markets. With a keen interest in macroeconomics, Anil aptly tracks global news/updates and stays well-informed about the global financial moves and their implications.

More from Anil Panchal
Share:

Editor's Picks

EUR/USD weakens below 1.1900, USD remains firm

EUR/USD has slipped back into its downtrend, drifting below the 1.1900 support as the US Dollar’s recovery keeps gathering traction. Indeed, the Greenback’s push higher gathered pace after President Trump named Kevin Warsh as Jerome Powell’s successor and US Producer Prices rose more than expected in December.

GBP/USD retreats further, threatens 1.3700

Selling pressure remains on the rise, dragging GBP/USD back towards three-day lows around 1.3720-1.3710 at the end of the week. Cable’s retracement reflects a firmer rebound in the Greenback as investors digest Trump’s announcement of the next Fed chair.

Gold remains offered just above $5,000

Gold is extending its pullback, managing to trim part of its strong losses and regain the $5,000 mark and beyond on Friday. The precious metal’s severe drop comes amid broad-based profit-taking across the commodity space, alongside a firmer US Dollar and mixed US Treasury yields.

Stellar deepens correction, slipping to 3-month low as risk-off mood persists

Stellar continues to trade in the red, slipping below $0.20 on Friday, a level not seen since mid-October. Bearish sentiment intensifies amid falling Open Interest and negative funding rates in the derivatives market. On the technical side, weakening momentum indicators support further correction in XLM.

Microsoft sell-off etches $400 billion hole in market, second highest on record

Microsoft's (MSFT) post-earnings cratering on Thursday sent other indices into pullback mode despite the narrow nature of its weakness.

Top 3 Price Prediction: Bitcoin, Ethereum, Ripple deepen sell-off as bears take control of momentum

Bitcoin, Ethereum, and Ripple continued their corrections on Friday, posting weekly losses of nearly 6%, 3%, and 5%, respectively. BTC is nearing the November lows at $80,000, while ETH slips below $2,800 amid increasing downside pressure.