Microsoft sell-off etches $400 billion hole in market, second highest on record
- Microsoft stock sinks 12% on heavy capex, uncertainty surrounding OpenAI.
- Microsoft's post-earnings tumble cost investors ~$400 billion, second highest in market history.
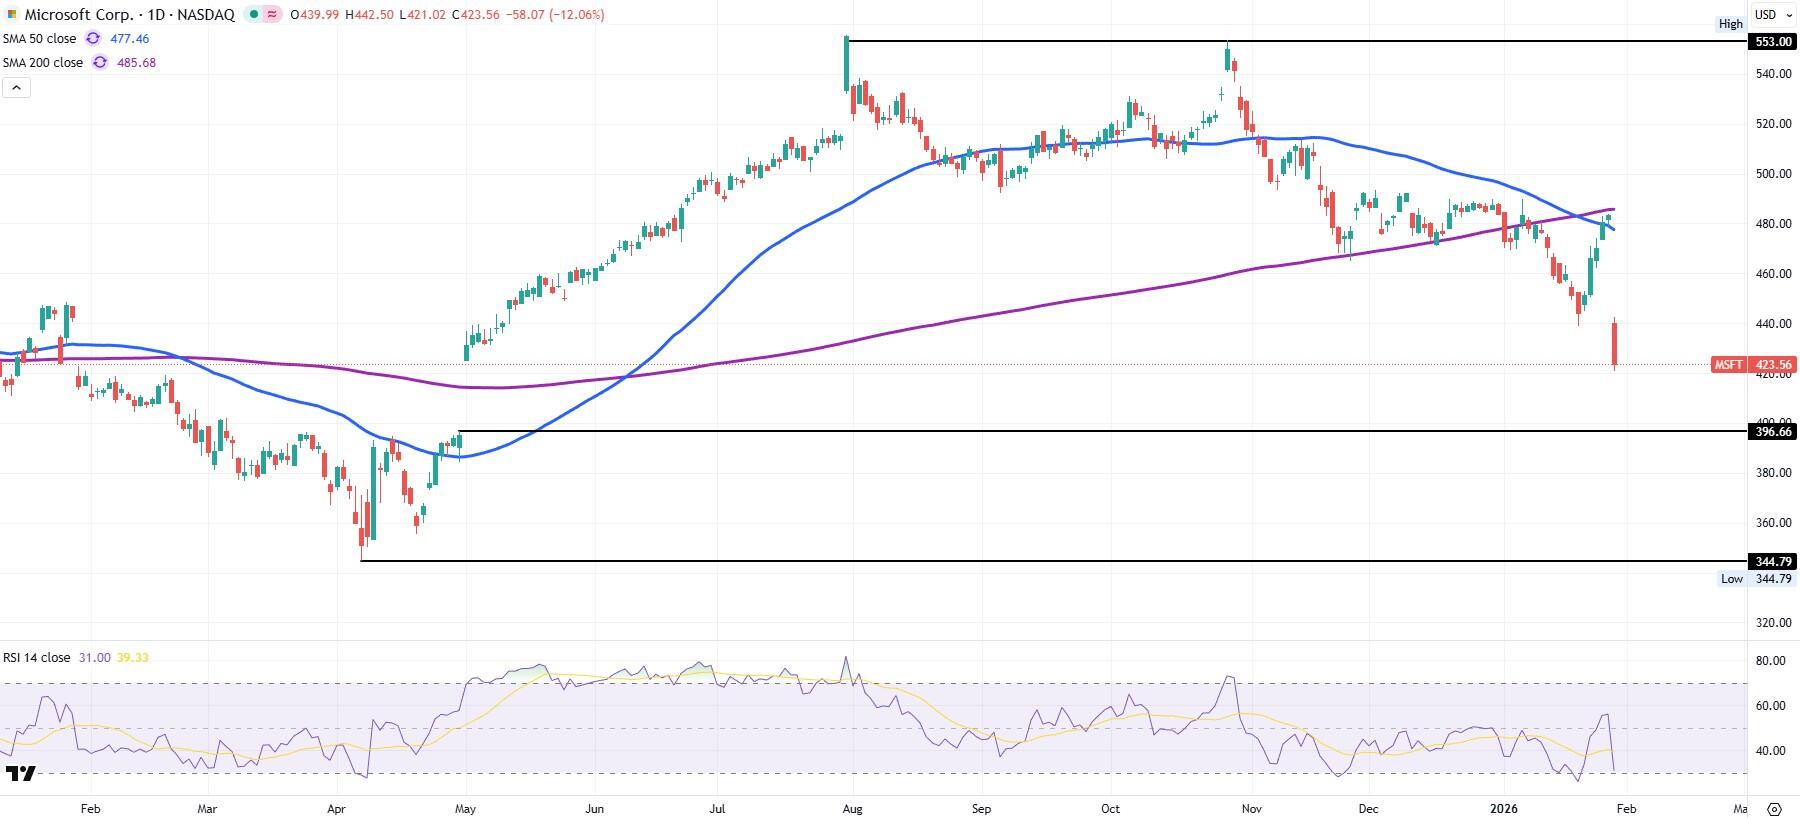
- MSFT shares are likely to close the gap with April 30, 2025, at $396.66.
- Most analysts retain price targets between $580 and $650.

Microsoft's (MSFT) post-earnings cratering on Thursday sent other indices into pullback mode despite the narrow nature of its weakness. Although it lost a more serene 4% afterhours on Wednesday following its resounding earnings beat, the Redmond, Washington-based Microsoft sank a solid 12% during the afternoon of Thursday's regular session.
Analysts blamed nerves surrounding the company's heavy capex ramp up, which is set to rise by two-thirds in 2026 as the company spends lavishly on building more data centers equipped with the latest AI chips. Additionally, some blamed the company's proximity to OpenAI, which is dealing with uncertainty in regard to its funding outlook.
The NASDAQ 100, nearing all-time highs from last October, shunted down more than 1% but found support just above the 50-day Simple Moving Average. The broader NASDAQ Composite lost 1.6% by 1:30 pm EST, while the S&P 500 gave up 0.6% and the Dow Jones barely budged, down 0.2%. Bitcoin also lost over 6%, trading down to $83,600 at the time of writing.
Microsoft sinks harshly after impressive earnings beat
Microsoft's major sell-off wiped away $400 billion in market cap — the second-largest, single-day market cap loss in US stock history after Nvidia's January 27, 2025, session that witnessed $600 billion evaporate. In percentage terms, it stands to become the seventh-largest sell-off in company history.
It is somewhat curious, then, since Wednesday's post-market earnings release for fiscal Q2 2026 looked impressive on its face. Microsoft earned $4.14 in adjusted EPS, $0.22 or 5.6% better than consensus. Revenue of $81.3 billion came in more than $1 billion ahead of consensus as well.
So, what gives?
Evercore analyst Kirk Materne lowered his price target from $640 to $580 but retained his Outperform rating.
"While Azure growth at these levels remains impressive and continues to suggest market share gains, capex rose 66% year over year," wrote Materne, "and investors are increasingly looking for clearer evidence that this elevated investment is translating into incremental Azure acceleration."
Materne pointed out that the 38% Azure cloud growth was impressive on its own, but that some sophisticated investors had expected growth to rise even higher due to the steep outlay in capex.
While Remaining Performance Obligations, excluding OpenAI, rose 28% to $345 billion, some investors are assuredly wary that the backlog owed to OpenAI is about 45% of the entire backlog.
"[O]ngoing concerns around OpenAI's funding outlook and Microsoft's exposure continue to represent a modest overhang," Materne noted. "We believe this concern should diminish over time, but it remains a headwind today."
OpenAI, which launched the AI Large Language Model (LLM) that started the present AI rally, continues to have large dreams and empty pockets. Microsoft, Amazon (AMZN) and Nvidia (NVDA) are presently in talks to invest as much as $60 billion in OpenAI to keep the party going, while Japan's SoftBank (SFTBY) is said to be considering another $30 billion.
As Microsoft has continued pumping its profits into data center expansion, its gross profit has fallen from 72% to 67% since late 2024.
RBC and Morgan Stanley retained their $640 and $650 price targets, respectively, but Morgan Stanley's client note did express concerns.
"The company's ability to exceed targets in this supply-constrained environment will largely be dictated by the pace of capacity build-outs, which may have less variability than investors imagined," wrote Keith Weiss of Morgan Stanley. "In addition to the physical constraints, Microsoft management is making allocation decisions for the limited supply [of] GPUs, balancing the growing needs of first-party applications like M365 Copilot and internal research efforts against Azure growth."
Other software stocks like ServiceNow (NOW), HubSpot (HUBS), ServiceTitan (TTAN) and SAP (SAP) also witnessed major sell-offs on Thursday.
Microsoft stock daily chart and technical analysis
Maybe we should have seen this coming? MSFT shares did put in a double-top back in July and October of 2025 near $553. And following recent weakness, the 50-day Simple Moving Average (SMA) did scale below the 200-day SMA just last week.
But it's all water under the bridge, and here we are. The first thing to notice on the daily chart below is that MSFT stock has drifted below the May 1, 2025, bullish gap. This leads to the unpleasant expectation that Microsoft's share price intends to close that gap with the high from April 30, 2025, at $396.66. This means that MSFT has another 6.5% to go before the natural support is in place. Although bears will notice that the bottom of the tariff sell-off from April 2025 sits much lower at $344.79, there's no theoretical reason that Microsoft is heading in that direction.
As it stands, the Relative Strength Index (RSI) is now at 31, making MSFT stock a technical buy for most risk profiles. As RBC's Rishi Jaluria wrote in a client note, "MSFT's AI footprint and cloud growth remain underappreciated, in our view, and we would be buyers on the pullback."
Premium
You have reached your limit of 3 free articles for this month.
Start your subscription and get access to all our original articles.
Author

Clay Webster
FXStreet
Clay Webster grew up in the US outside Buffalo, New York and Lancaster, Pennsylvania. He began investing after college following the 2008 financial crisis.


