|

Gold Price News and Forecast: XAU/USD is at critical support level

Is gold set to run higher?

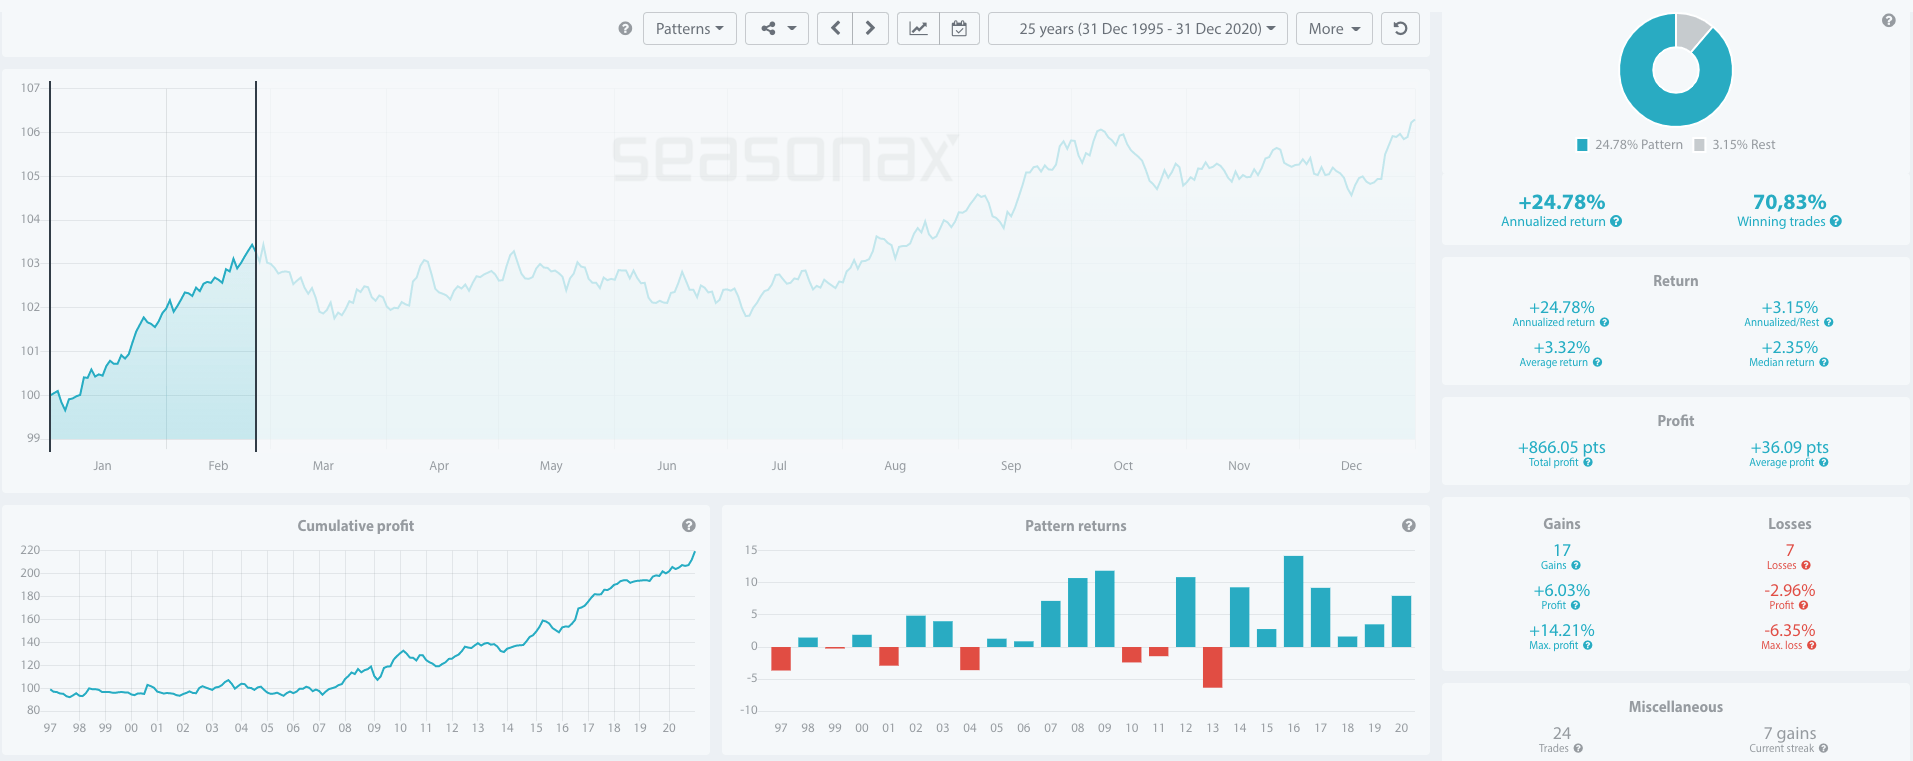
The recent run higher in gold looks set to continue based on the following reasons. There are some very strong seasonals in play with the Chinese Lunar New Year approaching. Gold tends to do very well at the start of the year and this point is being confirmed by the rise in ETF flows that are coming in at the start of the year.

Gold ETF flows start to rise again after bottoming out. The holdings in SPDR gold shares, which is the largest bullion backed ETF, grew by 17.2 tons on the first day of this week. That is the biggest amount of inflow since September. The last run higher in gold was driven by these rising ETF levels. This was despite the drop off in physical demand due to COVID-19. So, this means that gold looks set for higher prices based on the rising ETF flows. The ETF flows tend to trend and they also tend to move in tandem with gold prices. Rising ETF flows generally equates to rising gold prices and vice versa. Read more...

Gold

Gold is at critical support level

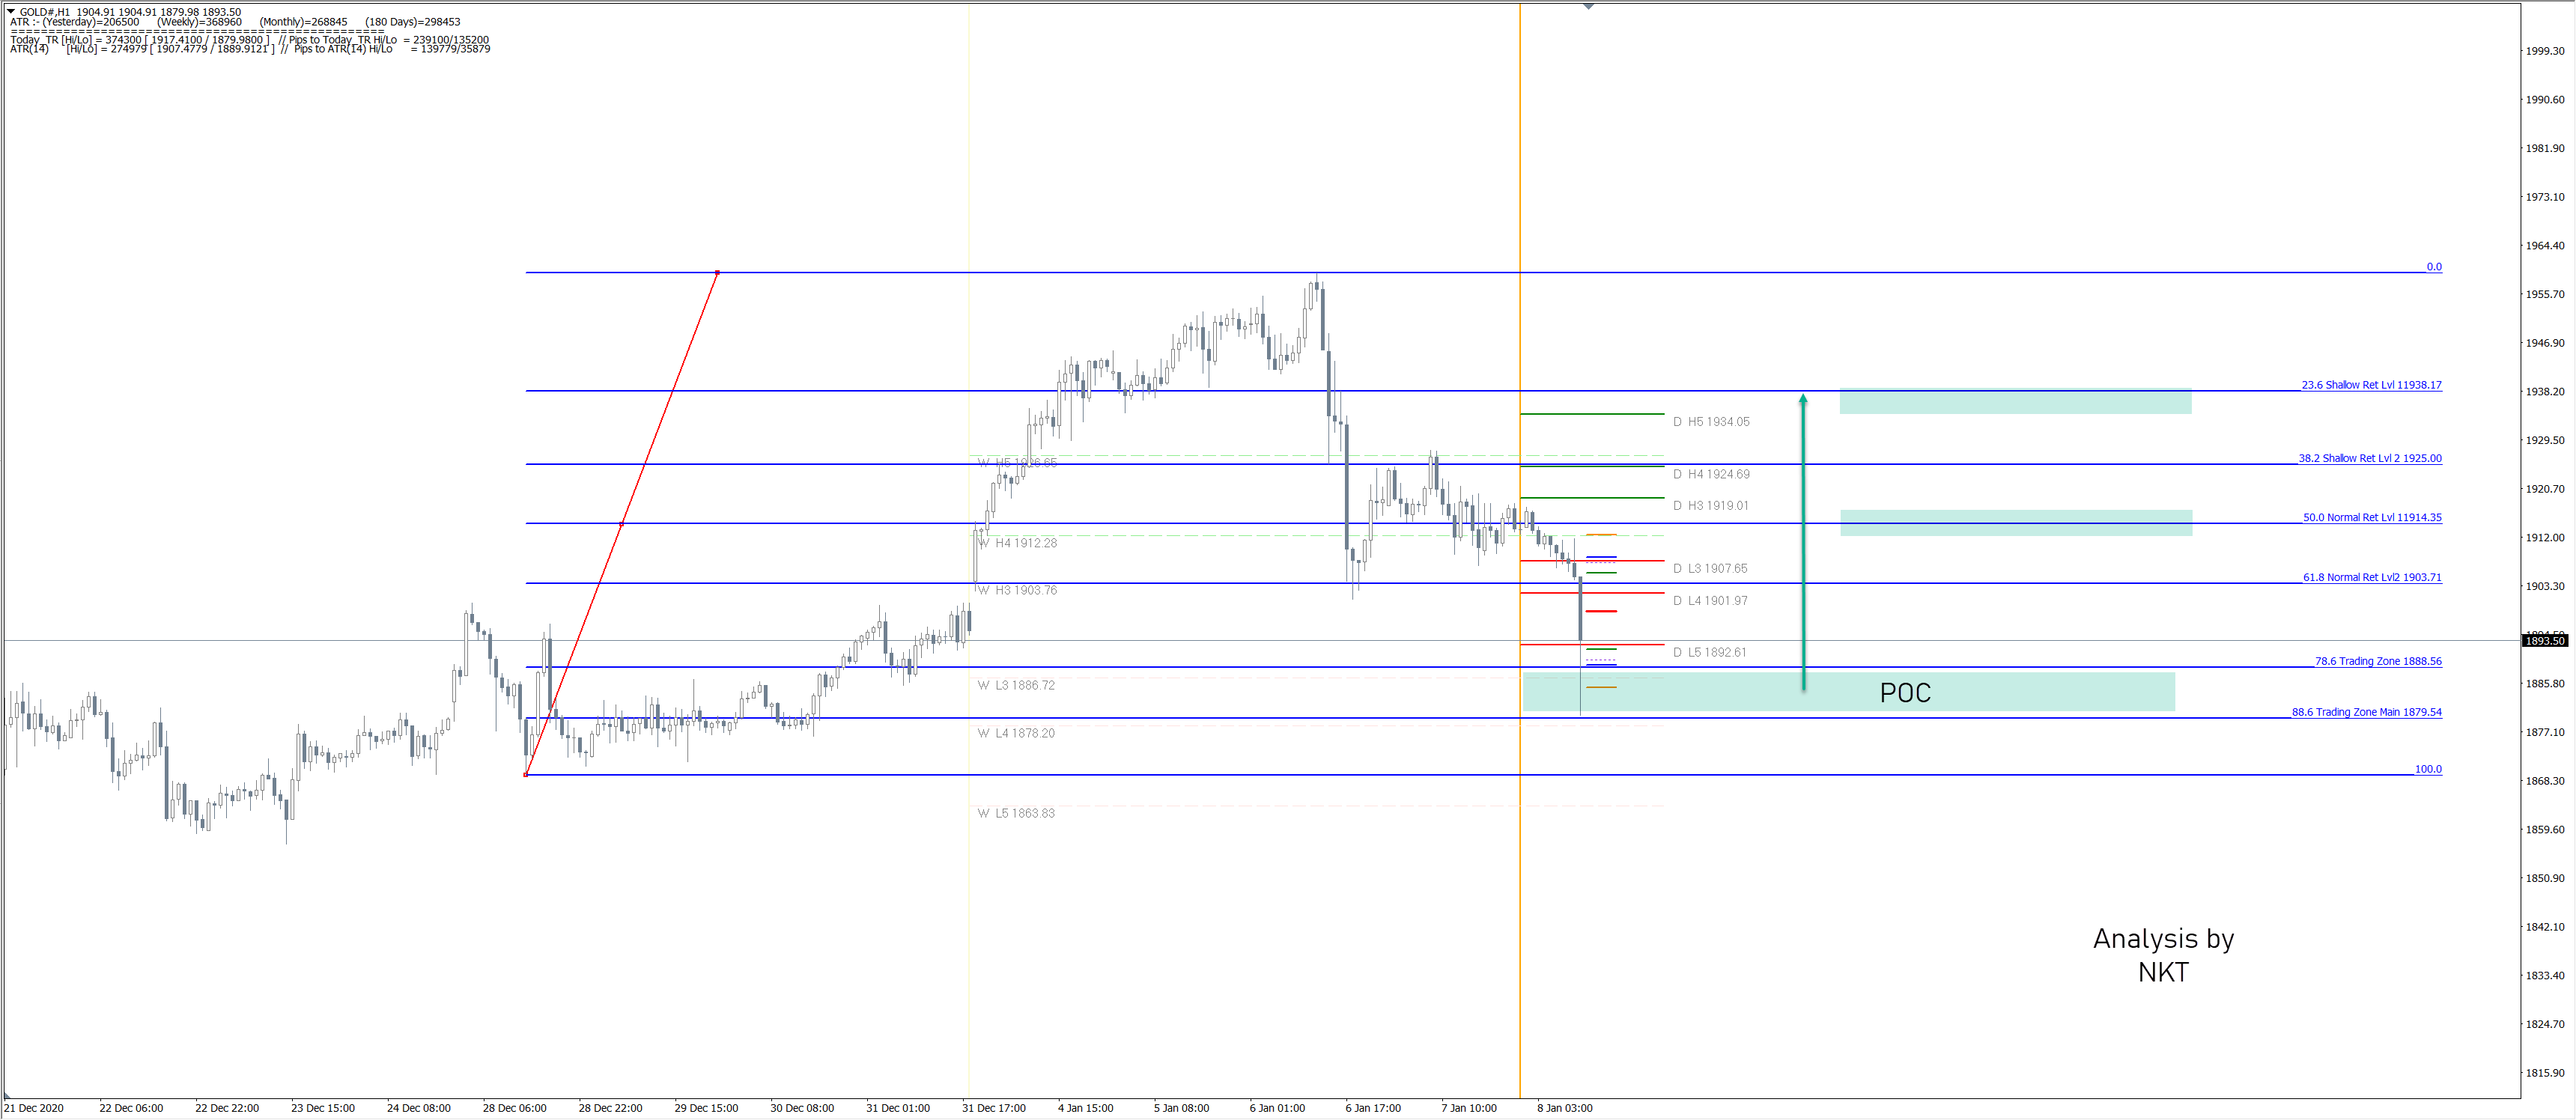
Gold is bullish and after a big retracement we might see the final attempt from bulls to spike the price up.

1879-1888 is the critical support zone. Below 1869 the weekly trend will change to bearish. If we see the bounce from the POC zone watch for 1914 and 1938 as targets. However, a break below 1868 might instruct the market to remain bearish next week so we will sell on rallies. Have in mind that GOLD is volatile and big moves can happen on Friday. Read more...

Gold

Gold Price Analysis: XAU/USD off lows, $1900 still at risk ahead of NFP

Gold (XAU/USD) has bounced-off a dip to near the $1906 region, as the bulls attempt a tepid recovery above the 200-hourly moving average (HMA), currently at $1909. Despite the pullback, gold’s path of least resistance appears to the downside, especially after the price confirmed a rising channel breakdown on the hourly chart in the Asian trades.

Bears eye a break below the critical $1900 level to accelerate the downside. Further south, the previous week low of $1869 could be tested. Meanwhile, the bearish bias will remain intact so long as the price holds below powerful resistance aligned around $1913, which is the confluence of the bearish 21-HMA and the channel support now resistance. Read more...

XAU/USD

Overview
Today last price1892.48
Today Daily Change-21.04
Today Daily Change %-1.10
Today daily open1913.52
 
Trends
Daily SMA201884.55
Daily SMA501869.55
Daily SMA1001893.22
Daily SMA2001838.13
 
Levels
Previous Daily High1927.76
Previous Daily Low1906.96
Previous Weekly High1901.02
Previous Weekly Low1869.32
Previous Monthly High1906.87
Previous Monthly Low1775.52
Daily Fibonacci 38.2%1914.91
Daily Fibonacci 61.8%1919.81
Daily Pivot Point S11904.4
Daily Pivot Point S21895.28
Daily Pivot Point S31883.6
Daily Pivot Point R11925.2
Daily Pivot Point R21936.88
Daily Pivot Point R31946

Author

More from FXStreet Team
Share:

Editor's Picks

EUR/USD treads water near 1.1800 ahead of ECB rate decision

EUR/USD is keeping its range at around 1.1800 in the European trading hours on Thursday. The pair awaits the European Central Bank interest rate decision for fresh impetus after the Eurozone inflation declined well below the central bank's 2% target. 

GBP/USD flirts with two-week lows near 1.3570

GBP/USD adds to Wednesday’s pullback and recedes to the area of two-week troughs well south of the 1.3600 level on Thursday. The firmer tone in the Greenback and the dovish hold from the BoE keep the British Pound on the defensive for now.

Gold resumes the decline, still below $5,000 post-ECB

Gold partially reverses its recent two-day rebound, facing fresh downside impulse and always below the key $5,000 mark per troy ounce. The stronger US Dollar continues to weigh on the precious metal, while declining US Treasury yields are expected to limit the decline somehow.

Bitcoin slips below $70,000 as falling knife scenario in play

Bitcoin (BTC) price dips below $70,000 on Thursday, having corrected nearly 20% for this year. Market momentum turned extremely bearish, with technical indicators pointing to further downside toward the next key support at $65,000.

The AI mirror just turned on tech and nobody likes the reflection

Tech just got hit with a different kind of selloff. Not the usual rates tantrum, not a recession whisper, not even an earnings miss in the classic sense. This was the market staring into an AI mirror and recoiling at its reflection.

Breaking: Bitcoin slips below $70,000 as falling knife scenario in play

Bitcoin (BTC) price dips below $70,000 on Thursday, having corrected nearly 20% for this year. Market momentum turned extremely bearish, with technical indicators pointing to further downside toward the next key support at $65,000.